
RENDER is finally showing signs of a shift on the 4-hour chart. After weeks of grinding lower inside a falling wedge, price has pushed through the upper trendline and now, it moves away from it. That matters, because this kind of structure usually breaks when selling pressure runs out instead of when sellers are in control.
What stands out is how the breakout played out. Volatility had been tightening, price action was compressing, and each sell-off was doing less damage than the last. Once buyers stepped in, the RENDER price broke higher and did not slip back into the wedge immediately…
- Why This RENDER Falling Wedge Break Is Getting Attention
- The RENDER Daily Chart Adds Confirmation
- What Needs to Happen Next
Why This RENDER Falling Wedge Break Is Getting Attention
On the 4-hour chart shared by Clifton a falling wedge is showing up and this normally happens near the end of corrective phases, and that seems to be the case here.
Even though the RENDER price was still printing lower highs, the downside momentum was fading. Sellers were pushing, but they were not getting much in return.
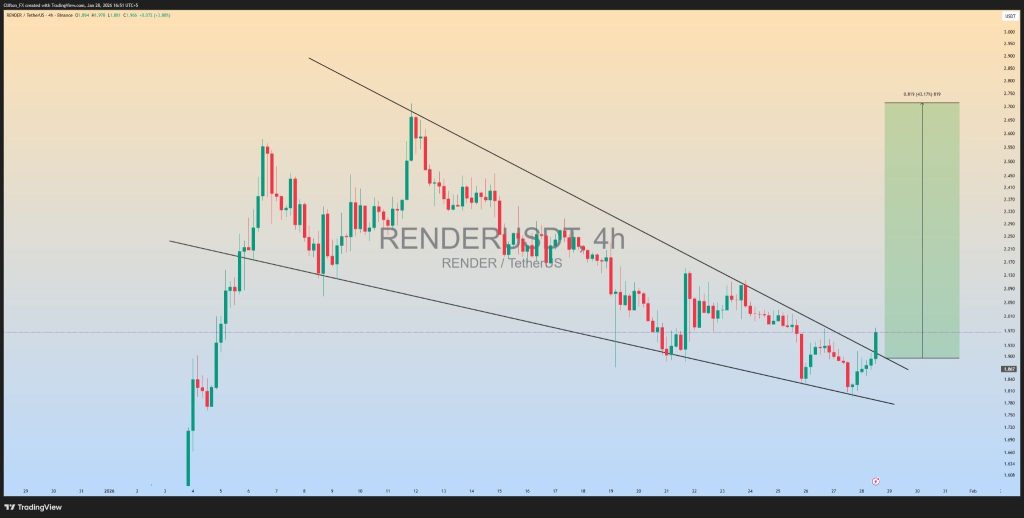
Source: X/@clifton_ideas
Once price cleared the top of the wedge, it opened space for a broader move. The upside projection on the chart highlights how much room the RENDER price could have if momentum continues to build.
It does not mean price shoots straight up, but it does show that this breakout is coming from a compressed base and not an overheated rally. As long as the RENDER price stays above the former wedge resistance, the breakout structure remains valid.
The RENDER Daily Chart Adds Confirmation
The daily chart helps put the move into context. The RENDER price dipped into a key Fibonacci support zone between $1.75 and $1.85, briefly tagging around $1.81 before buyers stepped in.
The price didn’t continue going lower, it quickly bounced back above $1.90, which is exactly what a clean support test usually looks like.
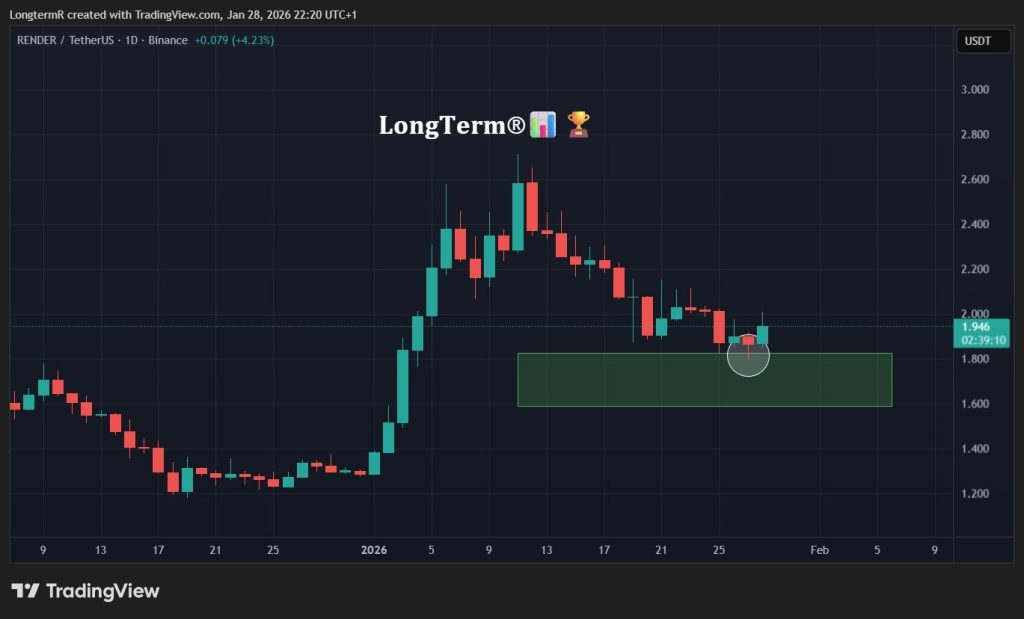
Source: X/@LongTermR
That kind of response suggests there was real demand waiting at those levels. It also supports the idea that this pullback was more of a reset than the beginning of a deeper decline, especially with buyers stepping in so decisively.
With the daily bounce lining up nicely with the 4-hour breakout, the RENDER price continues to hold a constructive structure as long as it stays above the $1.80 zone.
Kaspa (KAS) Price Prediction for February: Recovery Remains Unlikely_**
What Needs to Happen Next
Right now, the RENDER price is sitting at a clear decision point. The 4-hour chart is building steam, and on the daily chart, the support continues to hold at the critical price range of $1.80–$1.85.
In order to sustain the bullish view, the price needs to hold above the recent higher low at $1.81 and not fall back below the former breakout range at $1.85. As long as that happens, the structure remains constructive.
However, if the buyers continue to be on the upper end, RENDER could continue to move towards even stronger resistance levels of $2.10 and $2.30, which were out of reach during the fall.
But if the support levels continue to fall, the chances are that the stock will continue to move sideways between $1.75 and $1.95. The momentum is changing, and the key will be to see if the stock can move above $2.00 and hold on to the level.
Disclaimer: The information on this page may come from third parties and does not represent the views or opinions of Gate. The content displayed on this page is for reference only and does not constitute any financial, investment, or legal advice. Gate does not guarantee the accuracy or completeness of the information and shall not be liable for any losses arising from the use of this information. Virtual asset investments carry high risks and are subject to significant price volatility. You may lose all of your invested principal. Please fully understand the relevant risks and make prudent decisions based on your own financial situation and risk tolerance. For details, please refer to
Disclaimer.
Related Articles
Trump Announces Israel-Lebanon Ceasefire as Bitcoin Reclaims $75,000
April 17, Bitcoin returned to around $75,000 as U.S. President Trump announced a 10-day ceasefire agreement between Israel and Lebanon, boosting market sentiment. However, a CryptoQuant report shows that the proportion of large deposits has surged to over 40%, suggesting institutions may be preparing to sell. In addition, Bitcoin faces key technical resistance in the $76,000 to $76,800 range, and the market remains cautious about how events will unfold next.
MarketWhisper16m ago
Optimism boosted by the U.S.-Iran ceasefire agreement helps Bitcoin hold steady at 75K
Israel and Lebanon reached a 10-day ceasefire agreement, U.S. stock index benchmarks hit new highs, and market sentiment is optimistic. Bitcoin is hovering around 75K; with capital flowing in, the rally is gradually gaining momentum. Keep an eye on the 78K resistance level.
ChainNewsAbmedia1h ago
Bitcoin Hovers Near $75K as Whales Accumulate 270K BTC Over 30 Days, Largest Since 2013
Bitcoin nears $75,000, driven by significant whale accumulation of 270,000 BTC and low exchange reserves. Despite fluctuations and negative funding rates, it rebounded after geopolitical news, with futures inflows increasing since March.
GateNews4h ago
XRP Trading Volume Surges to $1.81B in Single Session, Holds Above $1.43
XRP trading volume reached $1.81 billion, driven by futures at $1.47 billion and spot trading at $341 million. Currently priced at $1.43, XRP is above the 200-day EMA, signaling bullish momentum and increased market participation.
GateNews6h ago
Dogecoin Holds $0.09 Support as $0.10 Breakout Looms
Dogecoin remains around $0.09, showing limited movement as traders await a clear breakout direction. Key support is at $0.08, with resistance at $0.10. Current technical indicators suggest a balanced market, but a decisive move is needed to shift momentum.
CryptoNewsLand6h ago
