
Key Takeaways
-
Algorand (ALGO) is consolidating after a 13% decline over the past 60 days, while showing stabilization in the last month.
-
The daily chart reveals a repeating bullish fractal, similar to the setup that triggered ALGO’s 300% rally in November 2024.
-
Price is holding inside a long-term accumulation zone between $0.11 and $0.1530.
-
The 200-day moving average near $0.1912 is acting as key resistance and breakout confirmation level.
-
A successful reclaim of the 200 MA could open the path toward $0.60 and the ascending resistance trendline, while a drop below $0.11 would invalidate the bullish setup.
ALGO, the native token of Algorand’s Layer-1 blockchain, has shown steady but muted momentum over the past 30 days, helping slow down its broader correction. Despite this stabilization, ALGO remains down more than 13% over the last 60 days, keeping sentiment cautious across the market.
That said, when looking beyond short-term price noise, the daily chart is beginning to tell a familiar story. The current structure closely resembles a bullish fractal that, in the past, preceded a powerful breakout rally—raising an important question for traders: is this just consolidation, or a quiet accumulation phase before the next move?
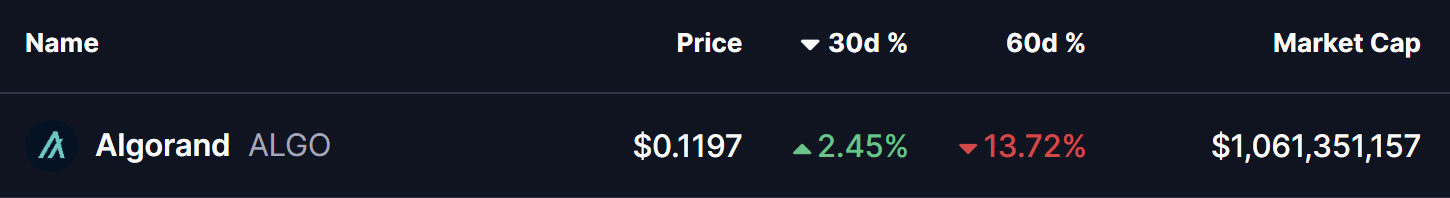
Source: Coinmarketcap
Fractal Setup Hints at a Bullish Reversal
On the daily timeframe, ALGO is displaying early signs of a repeating bullish structure, built around three key technical elements:
-
A rejection from the long-term ascending resistance trendline
-
A prolonged accumulation zone at major historical support
-
A potential reclaim of the 200-day moving average
The current corrective phase began in December 2024, when ALGO was rejected near the ascending resistance trendline around $0.60. That rejection triggered a deep pullback of more than 80%, eventually driving price back into the long-term demand zone between $0.11 and $0.1530—a region that has repeatedly acted as an accumulation area on the chart.
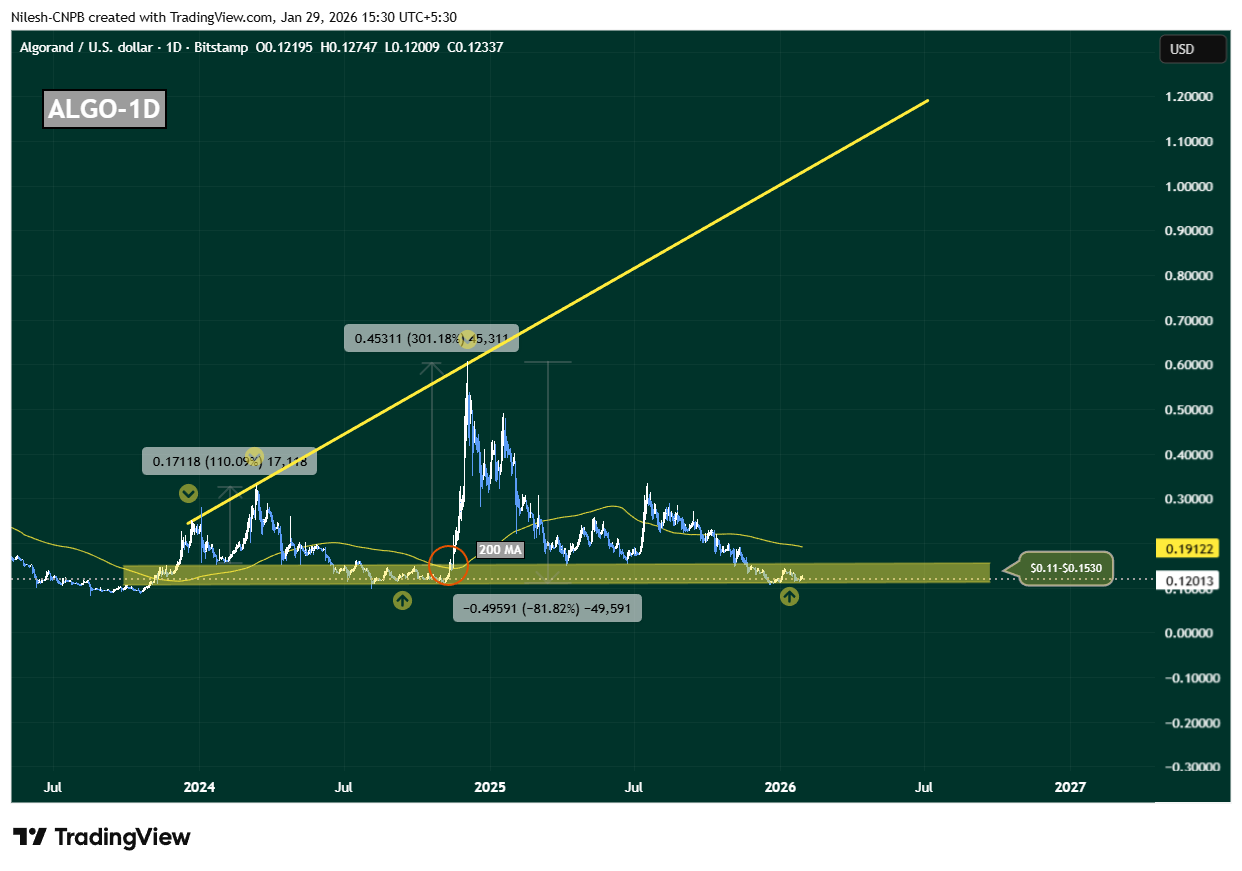
Algorand (ALGO) Daily Chart/Coinsprobe (Source: Tradingview)
This zone is not just technically important; it has also served as a launchpad during previous cycles, where downside momentum stalled and long-term buyers quietly stepped in.
History Rhymes on the ALGO Chart
What makes this setup particularly compelling is how closely it mirrors November 2024’s breakout structure. Back then, ALGO spent extended time consolidating near the same support band before reclaiming the 200-day moving average. Once that level flipped into support, price accelerated sharply—resulting in a 300% rally toward the ascending resistance trendline.
Today, ALGO is once again compressing inside this accumulation range, while the 200-day moving average sits overhead near $0.1912, acting as dynamic resistance. This alignment suggests the market may be approaching another inflection point.
What’s Next for ALGO?
At present, ALGO is hovering near $0.12, firmly inside its long-term accumulation zone. As long as price holds above this region, the broader bullish fractal remains intact.
A clean and sustained reclaim of the 200-day moving average around $0.1912 would be a critical confirmation signal. If bulls manage to flip this level into support, it would closely replicate previous breakout conditions and could trigger a sharp upside expansion. In that scenario, $0.60 becomes a realistic medium-term target, with further upside possible toward the ascending resistance trendline if momentum builds.
However, the structure is not without risk. A decisive breakdown below $0.11 would weaken the accumulation thesis, signal loss of long-term support, and open the door for deeper downside.
For now, ALGO sits at a make-or-break zone. The chart suggests patience is key—but if history repeats, this quiet phase may not last much longer.
Disclaimer: The views and analysis presented in this article are for informational purposes only and reflect the author’s perspective, not financial advice. Technical patterns and indicators discussed are subject to market volatility and may or may not yield the anticipated results. Investors are advised to exercise caution, conduct independent research, and make decisions aligned with their individual risk tolerance.
About Author: Nilesh Hembade is the Founder and Lead Author of Coinsprobe, with over 5 years of experience in the cryptocurrency and blockchain industry. Since launching Coinsprobe in 2023, he has been providing daily, research-driven insights through in-depth market analysis, on-chain data, and technical research.
Disclaimer: The information on this page may come from third parties and does not represent the views or opinions of Gate. The content displayed on this page is for reference only and does not constitute any financial, investment, or legal advice. Gate does not guarantee the accuracy or completeness of the information and shall not be liable for any losses arising from the use of this information. Virtual asset investments carry high risks and are subject to significant price volatility. You may lose all of your invested principal. Please fully understand the relevant risks and make prudent decisions based on your own financial situation and risk tolerance. For details, please refer to
Disclaimer.
Related Articles
Bitcoin Rises to $77,000 While Holding $75,000 Support as Traders Maintain Short Bias
Bitcoin rose to $77,000 today while maintaining $75,000 support. However, negative funding rates, unchanged open interest, and cautious trader positioning indicate a lack of conviction in the upside.
GateNews7m ago
Crypto Fear and Greed Index Rises to 40 Overnight, Up 15 Points from May 1
According to Coinglass data, the Crypto Fear and Greed Index rose to 40 overnight from May 1, up 15 points. The index remains in fear territory, down from the 7-day average of 33 and 30-day average of 24.
GateNews2h ago
JPMorgan: Stablecoin trading volume surges, but the velocity mechanism prevents market cap from growing proportionally
JPMorgan points out that stablecoin trading volume has risen rapidly, and that increased velocity means market cap may not grow in step; it expects stablecoin market cap to be $500-600 billion in 2028, taking a conservative stance versus the more optimistic trillion-dollar forecast. In 2026 Q1, market cap was $315 billion, trading volume was $28 trillion, and the annualized figure was $17.2 trillion. This view differs from a16z’s “programmable money” thesis, showing the stablecoin debate has entered mainstream institutional discussions.
ChainNewsAbmedia4h ago
JPMorgan: Stablecoin Usage Growth Won't Match Market Cap Rise
JPMorgan analysts led by managing director Nikolaos Panigirtzoglou said rising stablecoin usage may not lead to proportional growth in total stablecoin market capitalization, according to a recent report. The key reason is rising velocity—how often the same stablecoin is used in transactions—which m
CryptoFrontier4h ago
Bitcoin Bounces on May 1 as Big Tech Earnings Fuel Optimism
Bitcoin bounced on May 1, 2026, as positive earnings from major technology companies boosted market sentiment. Short-term pressures, however, continue to constrain gains.
GateNews4h ago
Bitcoin Climbs Above $78K as Senate Advances Crypto Legislation
Bitcoin recovered from a midweek dip to $75,500 to climb back above $78,000 by Saturday morning in Asia, according to the source. The recovery coincided with the Senate's passage of a stablecoin yield compromise, which removed a key roadblock to crypto market structure legislation.
## Price Recover
CryptoFrontier5h ago