Trade
Basic
Futures
Futures
Hundreds of contracts settled in USDT or BTC
TradFi
Gold
Trade global traditional assets with USDT in one place
Options
Hot
Trade European-style vanilla options
Unified Account
Maximize your capital efficiency
Demo Trading
Futures Kickoff
Get prepared for your futures trading
Futures Events
Participate in events to win generous rewards
Demo Trading
Use virtual funds to experience risk-free trading
Earn
Launch
CandyDrop
Collect candies to earn airdrops
Launchpool
Quick staking, earn potential new tokens
HODLer Airdrop
Hold GT and get massive airdrops for free
Launchpad
Be early to the next big token project
Alpha Points
Trade on-chain assets and enjoy airdrop rewards!
Futures Points
Earn futures points and claim airdrop rewards
Investment
Simple Earn
Earn interests with idle tokens
Auto-Invest
Auto-invest on a regular basis
Dual Investment
Buy low and sell high to take profits from price fluctuations
Soft Staking
Earn rewards with flexible staking
Crypto Loan
0 Fees
Pledge one crypto to borrow another
Lending Center
One-stop lending hub
VIP Wealth Hub
Customized wealth management empowers your assets growth
Private Wealth Management
Customized asset management to grow your digital assets
Quant Fund
Top asset management team helps you profit without hassle
Staking
Stake cryptos to earn in PoS products
Smart Leverage
New
No forced liquidation before maturity, worry-free leveraged gains
GUSD Minting
Use USDT/USDC to mint GUSD for treasury-level yields
More
RJT_WAGMI
No content yet
RJT_WAGMI
BREAKING:
🇺🇸 President Trump just posted this:
“The United States Navy will begin escorting tankers through the Strait of Hormuz, as soon as possible.”
🇺🇸 President Trump just posted this:
“The United States Navy will begin escorting tankers through the Strait of Hormuz, as soon as possible.”
- Reward
- 3
- 1
- Repost
- Share
GateUser-46e0c16d:
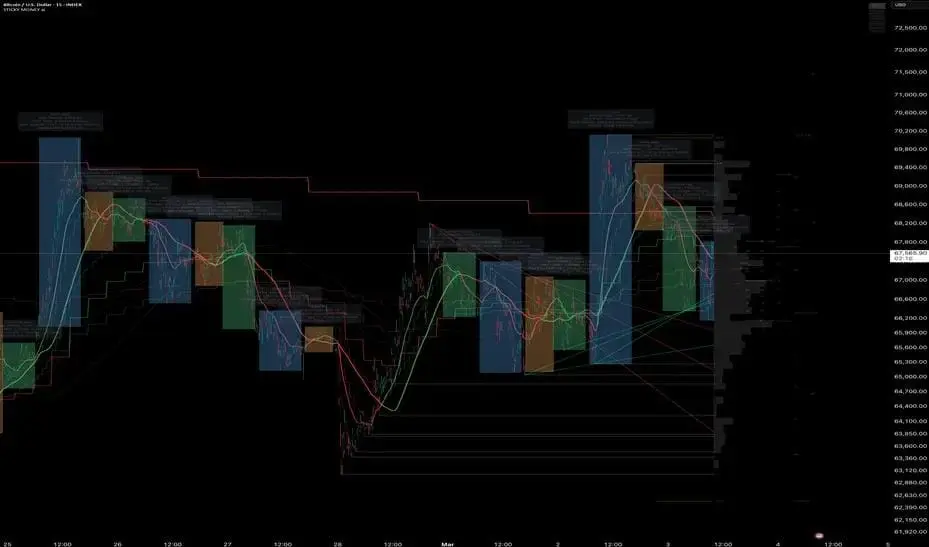
BullishBTCUSD — Rejected at $70K, watching $67K support for next move
$BTC pushed to $69.8K yesterday and got slapped back hard. Now sitting at $67,600
on the 15m — right in the middle of a high-volume acceptance zone on the volume
profile.
What the chart is showing:
1. Session box (blue) captured yesterday's full impulse from $65K to $69.8K. That
entire move just gave back 50%+ in one session.
2. Volume profile shows heavy acceptance around $67-68K — this is where the market
agreed on price during the previous consolidation. If it holds, this is a base
for another attempt at $70K.
3. Red structural
BTC0,23%
- Reward
- 2
- 1
- Repost
- Share
GateUser-46e0c16d:
Eyes on itBREAKING: Trump Cuts Off Trade With Spain — Trade War Risks Rising Again
This just escalated fast.
President Trump has announced that he is cutting off all trade dealings with Spain after the Spanish government refused to allow the U.S. military to use its air bases for potential operations against Iran. What started as a military disagreement has now turned into economic retaliation.
Spain made it clear that it would not permit its territory to be used for offensive action. From their perspective, this was about sovereignty and control over national decisions. From Trump’s perspective, this w

- Reward
- 2
- 1
- Repost
- Share
GateUser-46e0c16d:
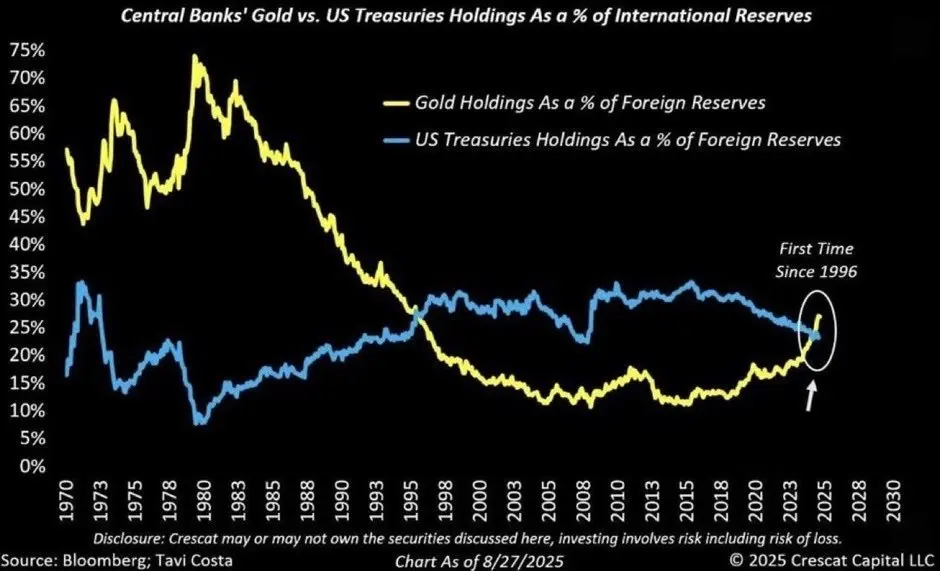
🔥🔥Foreign Central Banks Now Hold More Gold Than U.S. Treasuries — A Quiet but Powerful Shift
Something major just happened — and most people aren’t talking about it enough.
For the first time in almost 30 years, foreign central banks now hold more gold than U.S. Treasuries. That’s not a small portfolio adjustment. That’s a structural shift in how the world is thinking about reserves, risk, and trust.
For decades, U.S. Treasuries were the ultimate reserve asset. Deep liquidity. Dollar dominance. Stability. If you were a central bank managing national reserves, Treasuries were the default choice.
- Reward
- 2
- 1
- Repost
- Share
GateUser-46e0c16d:
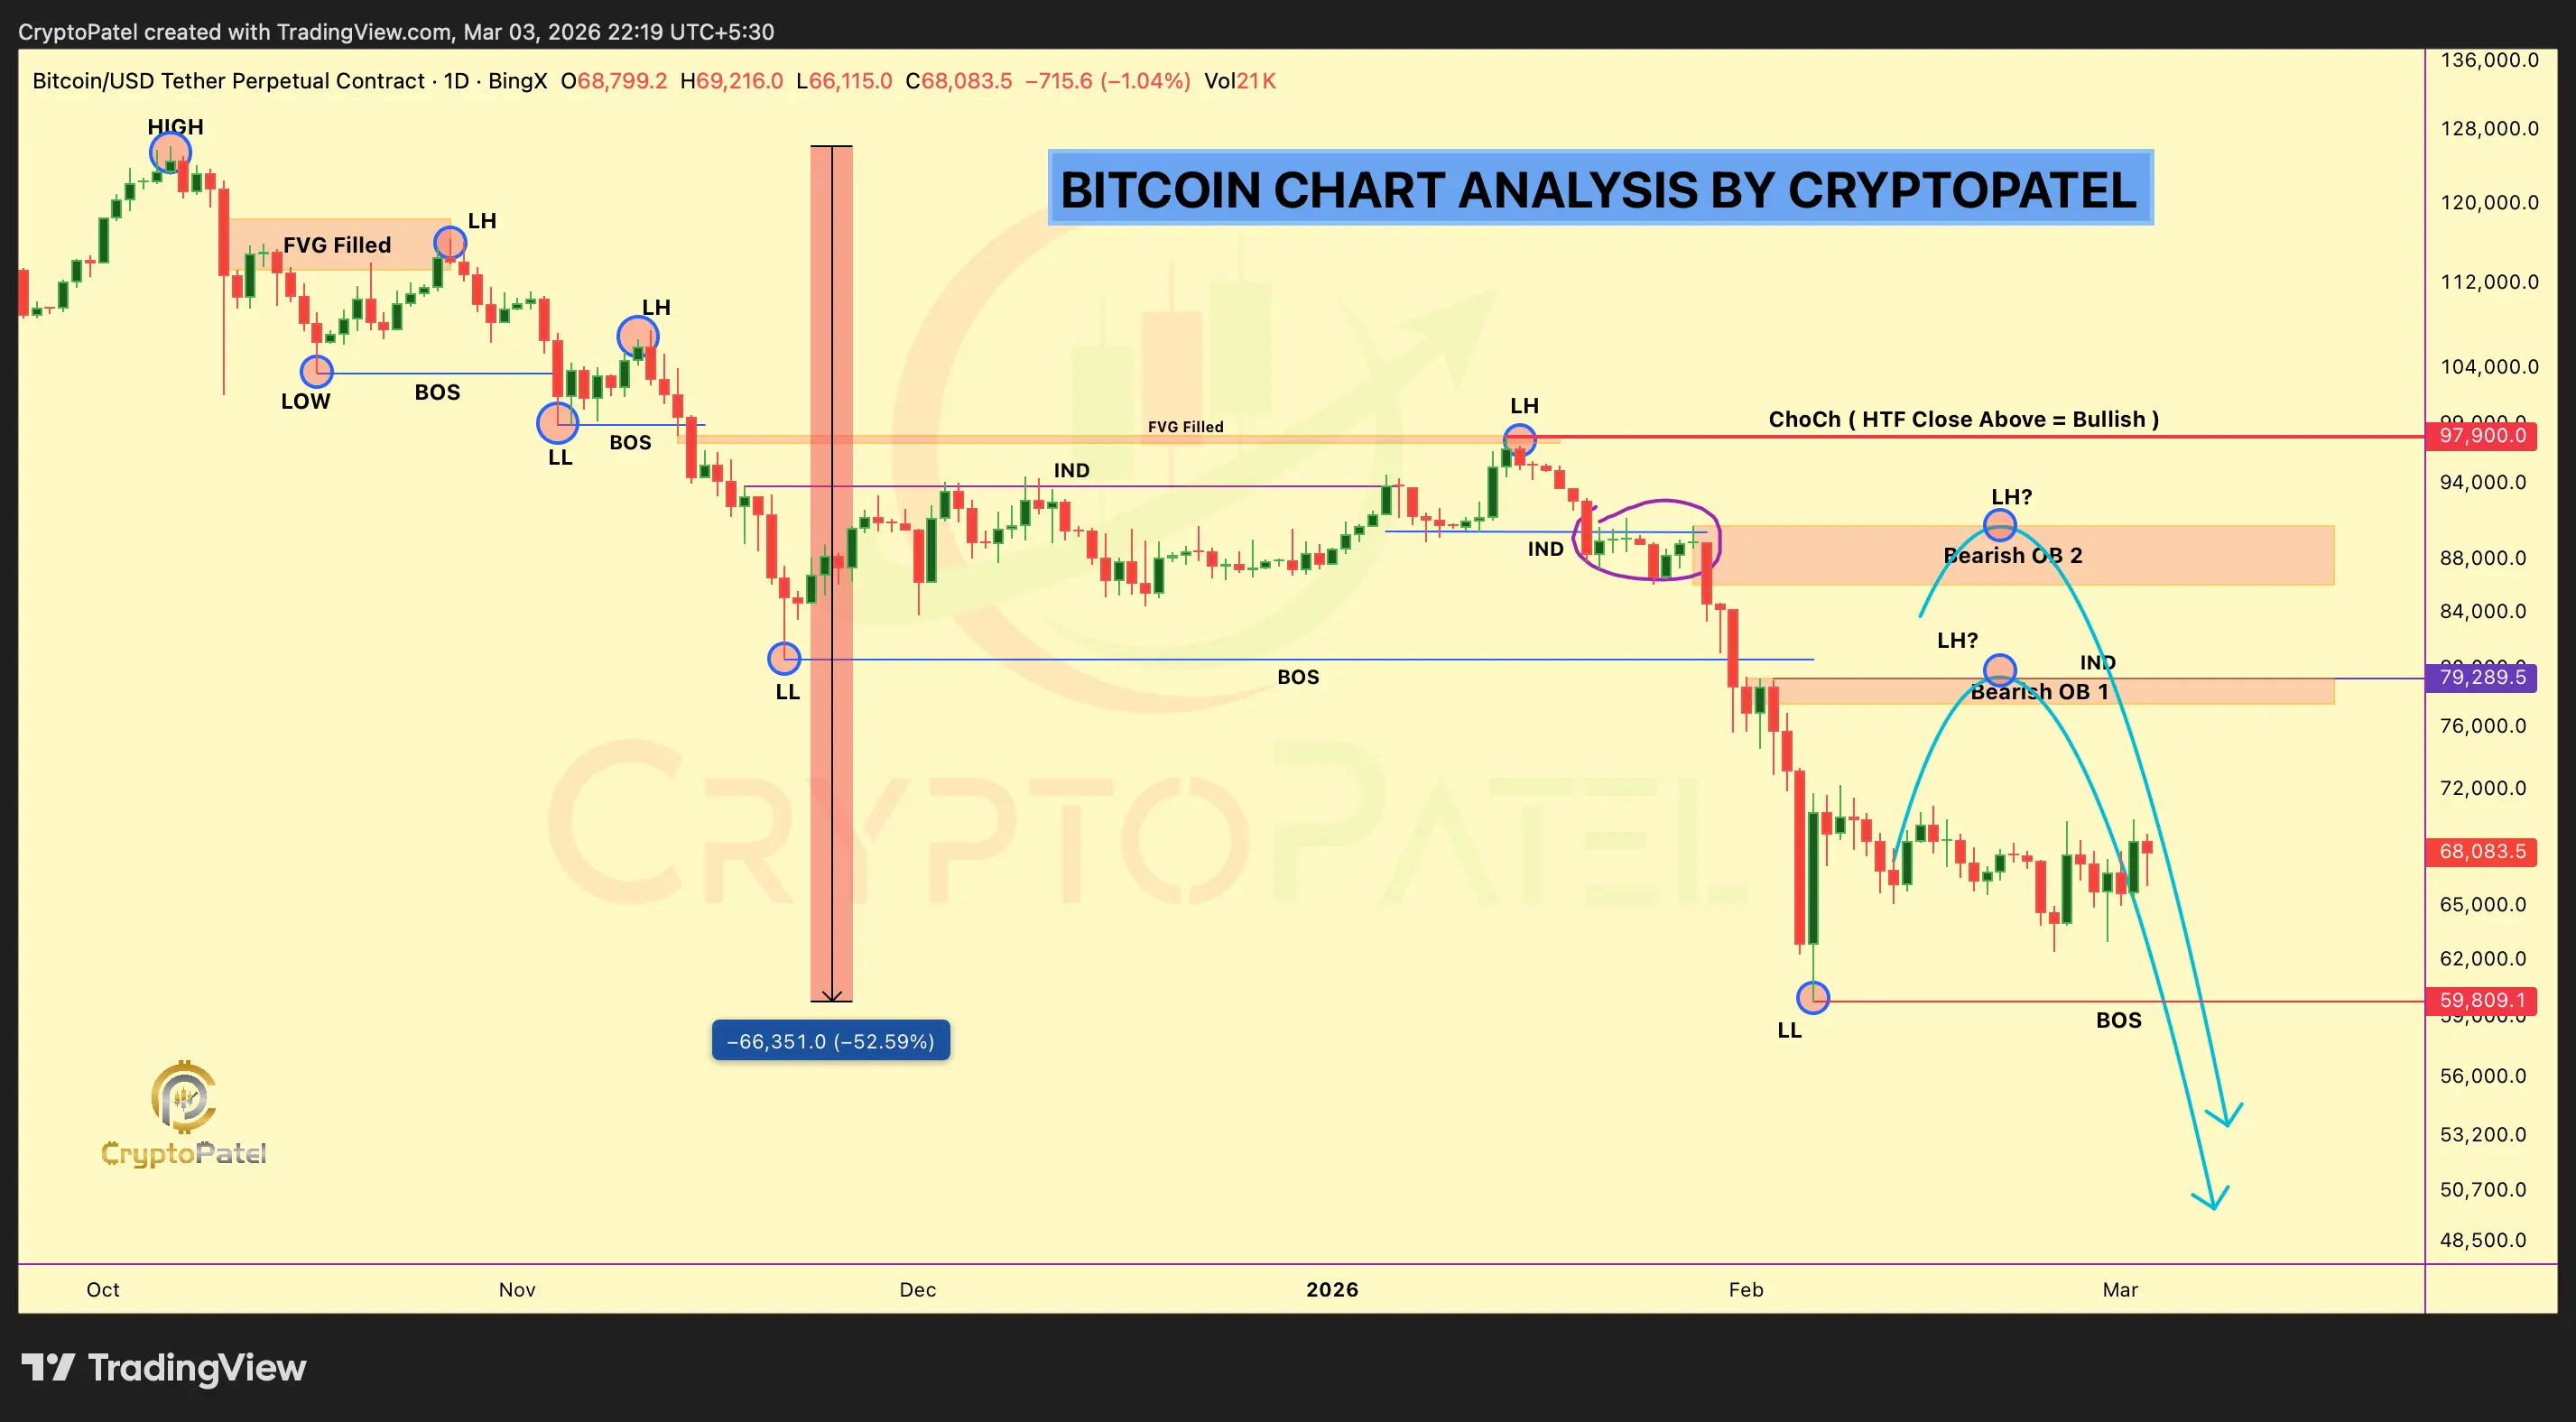
good analysisBitcoin Structure Is Telling a Clear Story — But Are You Listening?
I’ve been studying this $BTC 1D chart closely, and the structure is not random. It’s systematic. It’s clean. And it’s sending a message most traders are ignoring.
Let’s break it down.
We printed a clear HIGH, followed by consistent Lower Highs (LH) and Lower Lows (LL). Every bounce has been corrective — not impulsive. That distinction matters.
After the initial breakdown, we saw multiple BOS (Break of Structure) confirmations to the downside. Each BOS wasn’t just a random wick — it was a structural shift supported by continua
BTC0,23%
- Reward
- 2
- 1
- Repost
- Share
GateUser-46e0c16d:
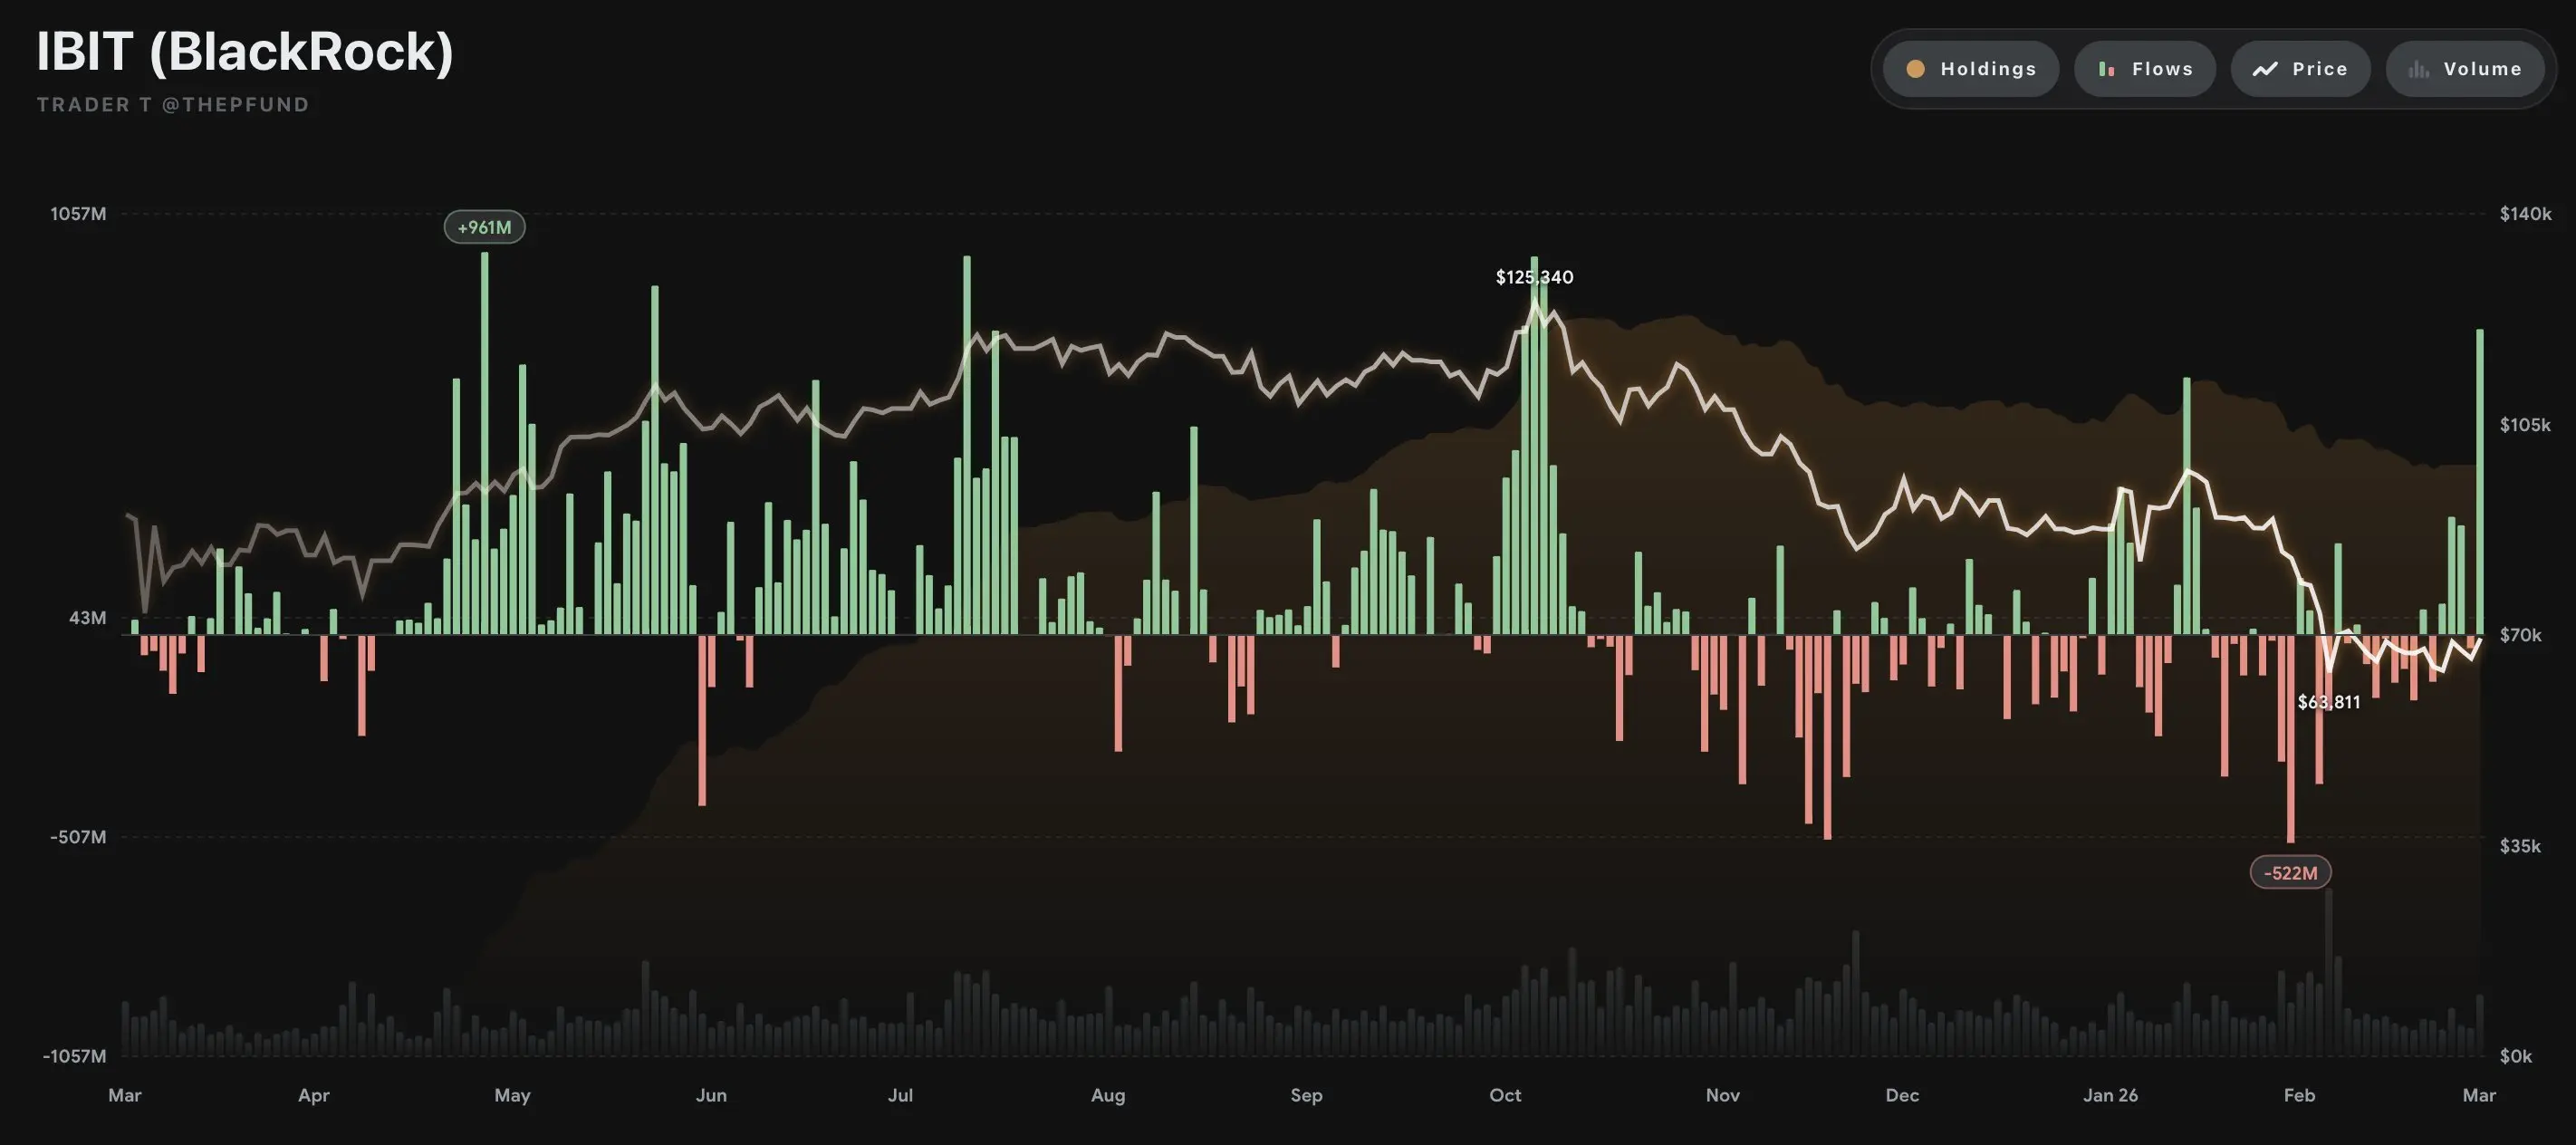
Amazing good analysisHUGE Inflows Again for Bitcoin — Capital Is Moving
Bitcoin is seeing massive inflows again, and this is not something I ignore. When serious capital starts flowing back into Bitcoin, it tells me the market is shifting beneath the surface. Price is one thing — but flows are another story entirely. And right now, the flow narrative is loud.
Big inflows mean one simple thing: money is choosing Bitcoin. Whether it’s ETFs, institutions, large wallets, or funds reallocating exposure, capital doesn’t move without reason. Investors don’t deploy size randomly. They position when they see opportunity, m
BTC0,23%
- Reward
- 3
- 1
- Repost
- Share
GateUser-46e0c16d:
🔥HUGE Inflows Again for Bitcoin — Capital Is Moving
Bitcoin is seeing massive inflows again, and this is not something I ignore. When serious capital starts flowing back into Bitcoin, it tells me the market is shifting beneath the surface. Price is one thing — but flows are another story entirely. And right now, the flow narrative is loud.
Big inflows mean one simple thing: money is choosing Bitcoin. Whether it’s ETFs, institutions, large wallets, or funds reallocating exposure, capital doesn’t move without reason. Investors don’t deploy size randomly. They position when they see opportunity, m
BTC0,23%

- Reward
- 2
- Comment
- Repost
- Share
- Reward
- 1
- 1
- Repost
- Share
GateUser-46e0c16d:
2026 GOGOGO 👊🇺🇸 ETF FLOWS: BTC, ETH, SOL and XRP spot ETFs saw net inflows on Mar. 2.
BTC: $458.19M
ETH: $38.69M
SOL: $17.41M
XRP: $6.97M
BTC: $458.19M
ETH: $38.69M
SOL: $17.41M
XRP: $6.97M


- Reward
- 1
- 1
- Repost
- Share
GateUser-46e0c16d:
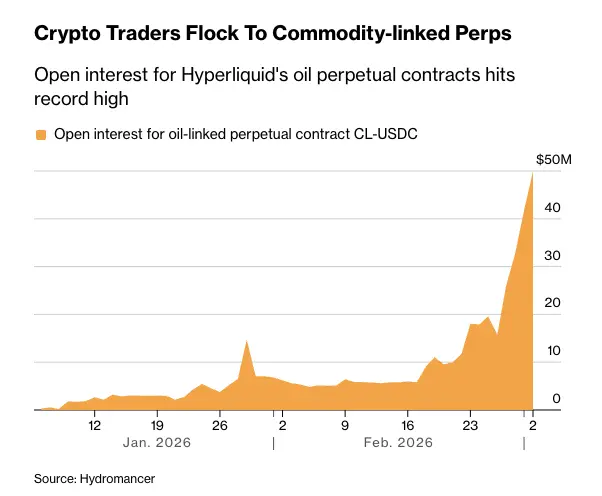
To The Moon 🌕🚨 Capital Rotation Is Getting Real.
Open interest in Hyperliquid’s oil perpetual contract (CL-USDC) has just surged to an all-time high near $50M, according to Bloomberg.
Let that sink in.
Crypto traders aren’t just trading BTC and ETH anymore — they’re actively rotating into commodity-linked perps, and oil is leading the move.
Here’s what this signals:
• Traders want exposure to real-world macro volatility
• Oil is becoming a hedge against crypto-native uncertainty
• On-chain derivatives are expanding beyond pure crypto assets
• Capital is diversifying, not leaving — just repositioning
When
BTC0,23%
- Reward
- 1
- 1
- Repost
- Share
GateUser-46e0c16d:
2026 GOGOGO 👊🚨 Capital Rotation Is Getting Real.
Open interest in Hyperliquid’s oil perpetual contract (CL-USDC) has just surged to an all-time high near $50M, according to Bloomberg.
Let that sink in.
Crypto traders aren’t just trading BTC and ETH anymore — they’re actively rotating into commodity-linked perps, and oil is leading the move.
Here’s what this signals:
• Traders want exposure to real-world macro volatility
• Oil is becoming a hedge against crypto-native uncertainty
• On-chain derivatives are expanding beyond pure crypto assets
• Capital is diversifying, not leaving — just repositioning
When
BTC0,23%

- Reward
- 1
- 1
- Repost
- Share
GateUser-46e0c16d:
LFG 🔥🚨 BREAKING:
BlackRock buys $767,470,000 worth of Bitcoin.
Largest inflow in 5 months
BlackRock buys $767,470,000 worth of Bitcoin.
Largest inflow in 5 months


- Reward
- 1
- Comment
- Repost
- Share
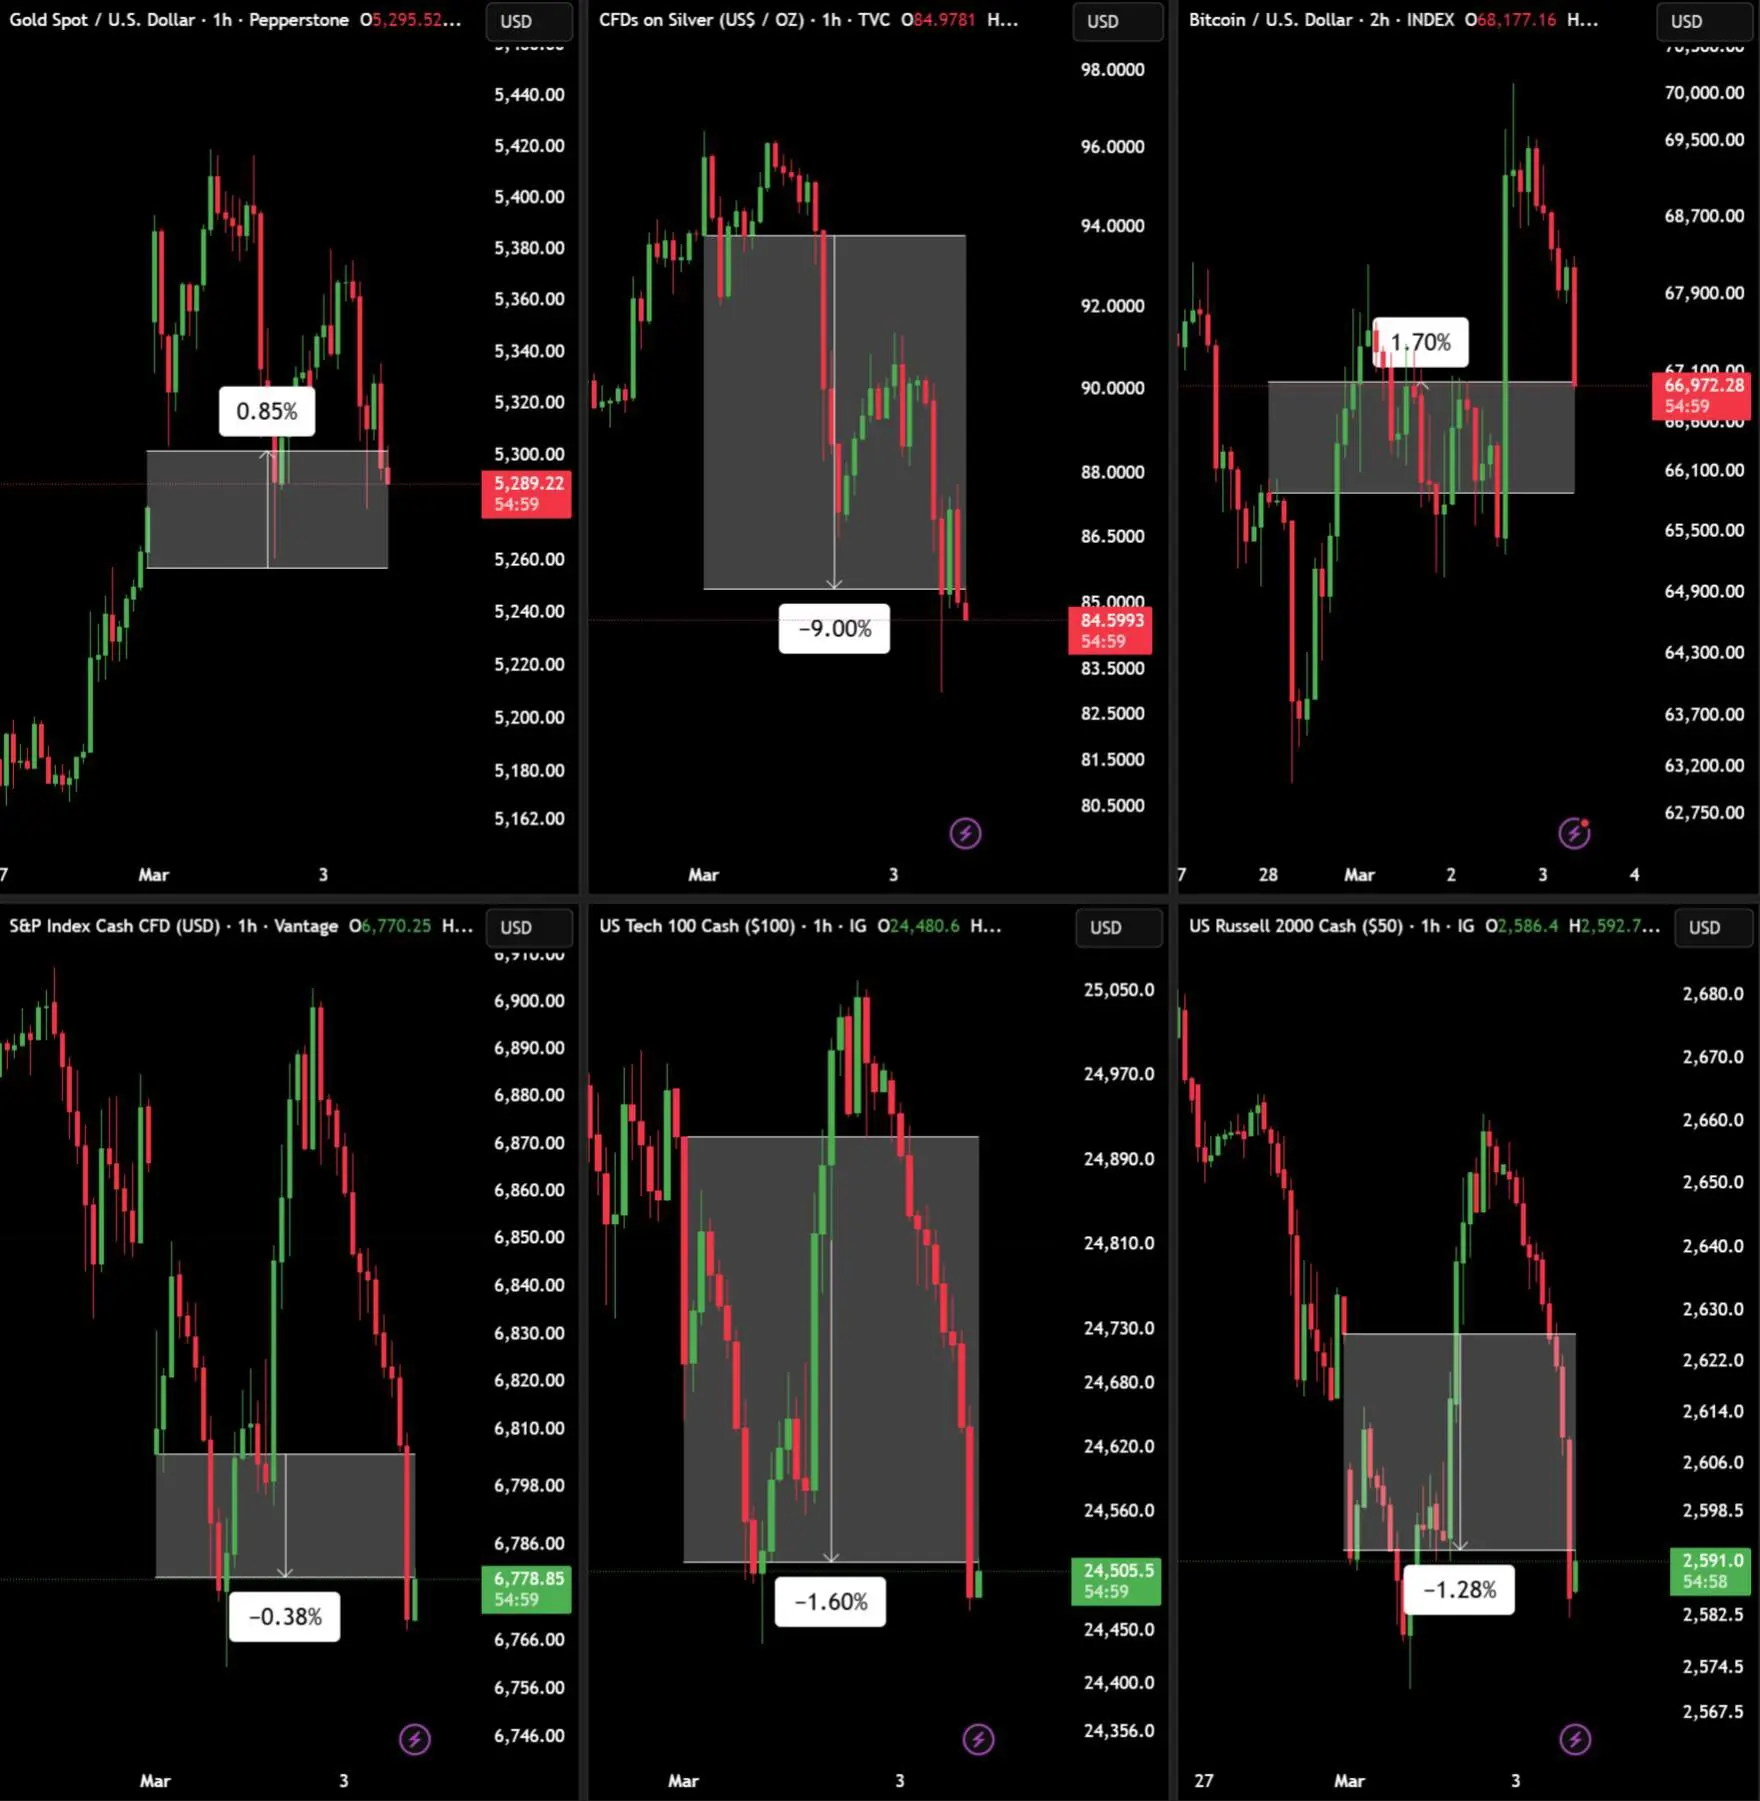
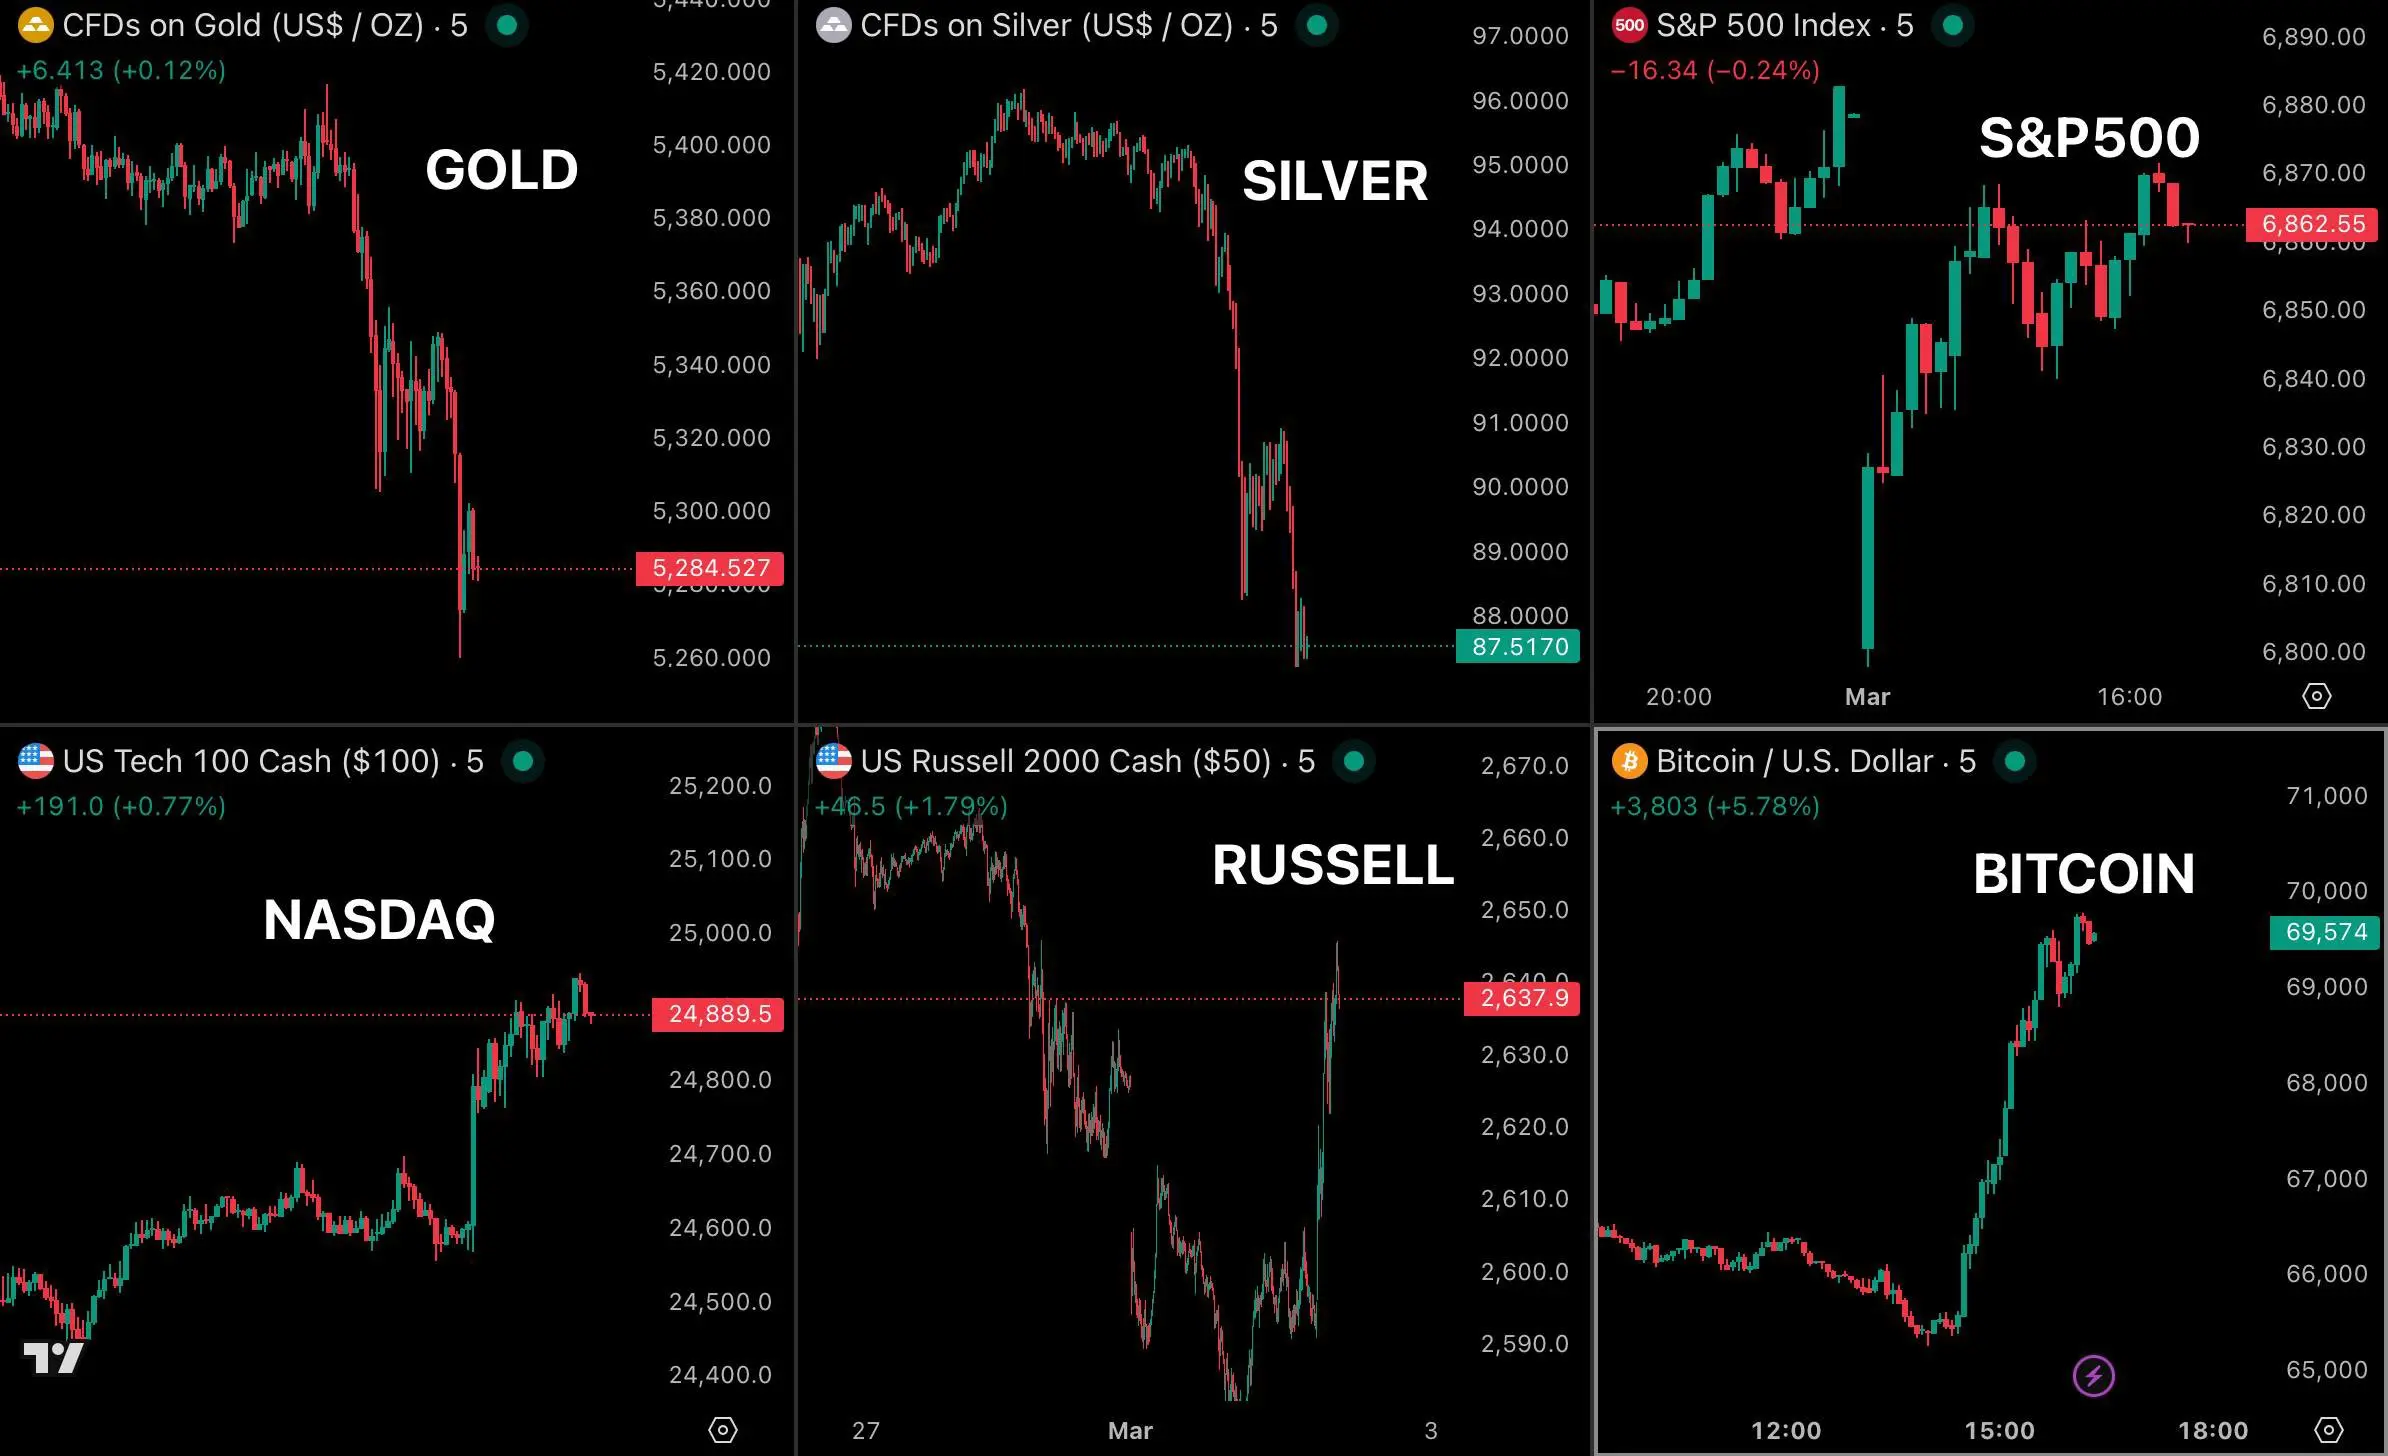
The market just SURPRISED everyone.
In the past 2 hours,
over $1 TRILLION has been wiped out from gold and silver, while nearly $800 BILLION has been added to crypto and the U.S. stock market.
Gold is down 1.78%, wiping out $650 billion in value.
Silver is down 6.82%, wiping out $340 billion.
Nasdaq is up 1.73%, adding $610 billion.
SPX is up 1.08% adding $80 billion.
Russell 2000 is up 1.72%, adding $53 billion.
Bitcoin is up 6.7%, adding $80 billion.
$BTC
BTC0,23%
- Reward
- 2
- Comment
- Repost
- Share
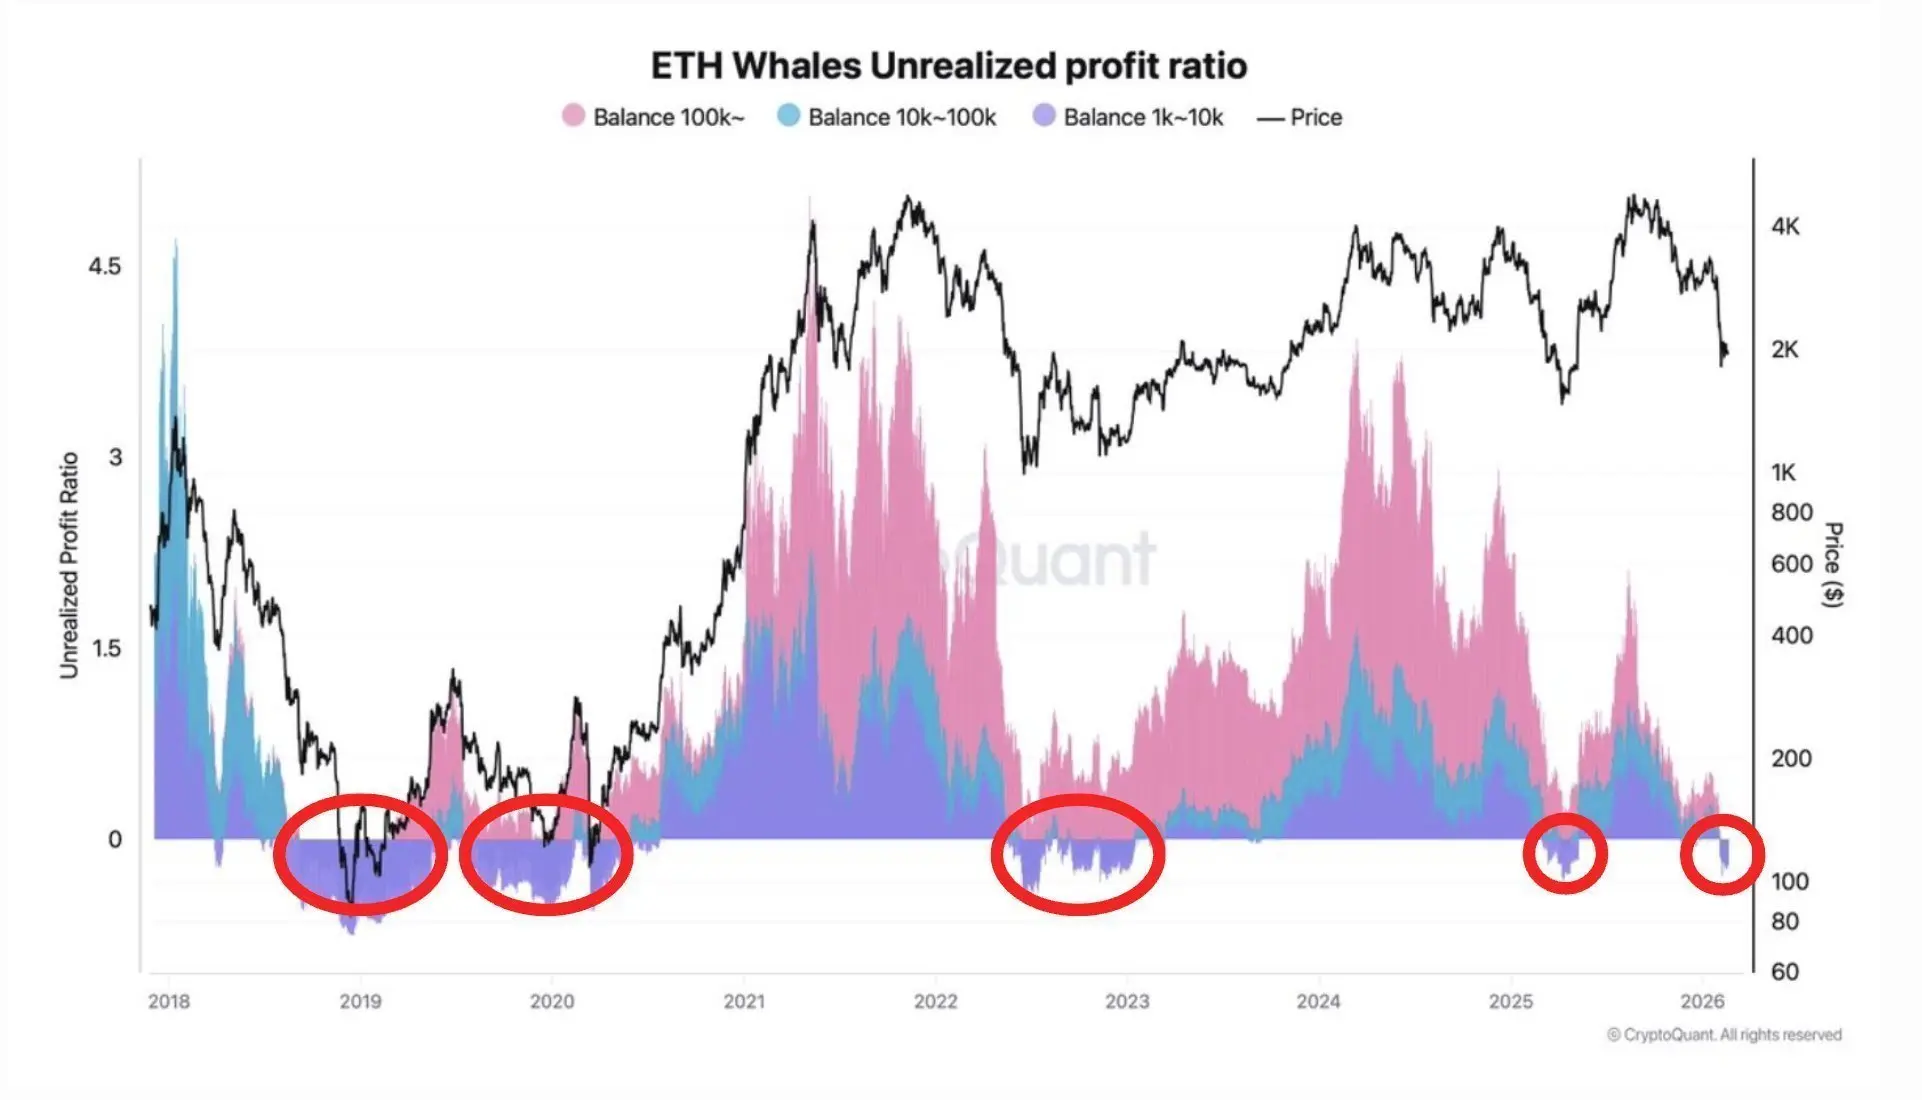
Large $ETH whales are underwater.
And if you’ve been in this market long enough, you already know what that usually means.
The latest on-chain data shows the Unrealized Profit Ratio for wallets holding 1K–100K ETH dipping into negative territory. Historically, every time whales in this cohort went underwater — 2019, 2020, late 2022 — it marked late-stage capitulation zones, not cycle tops.
When smart money is sitting at a loss, two things typically happen:
Weak hands are already flushed out.
Accumulation quietly begins while sentiment is still bearish.
Whales don’t chase green candles. They p
ETH-1,25%
- Reward
- 3
- Comment
- Repost
- Share
🇺🇸 HUGE: A federal appeals court rejected the Trump administration’s request to delay tariff refund litigation, allowing importer refund cases to move forward.


- Reward
- 2
- Comment
- Repost
- Share
- Reward
- 4
- Comment
- Repost
- Share
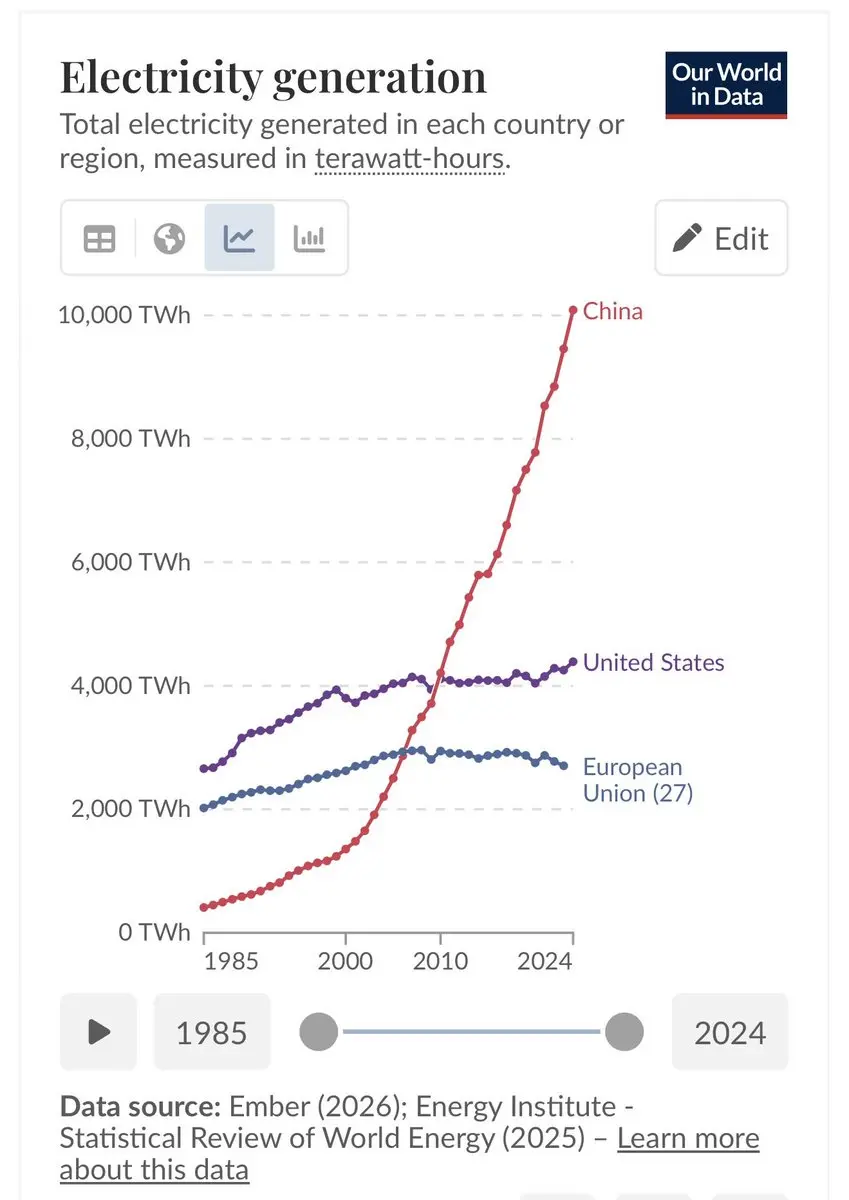
🇨🇳 BIG: China produces 40% more electricity than the US and EU combined.
- Reward
- 5
- 2
- Repost
- Share
repanzal :
:
To The Moon 🌕View More