


Round 18 prize pool just opened — Gold is now live
🎰 Watch-to-Earn Prize Carnival
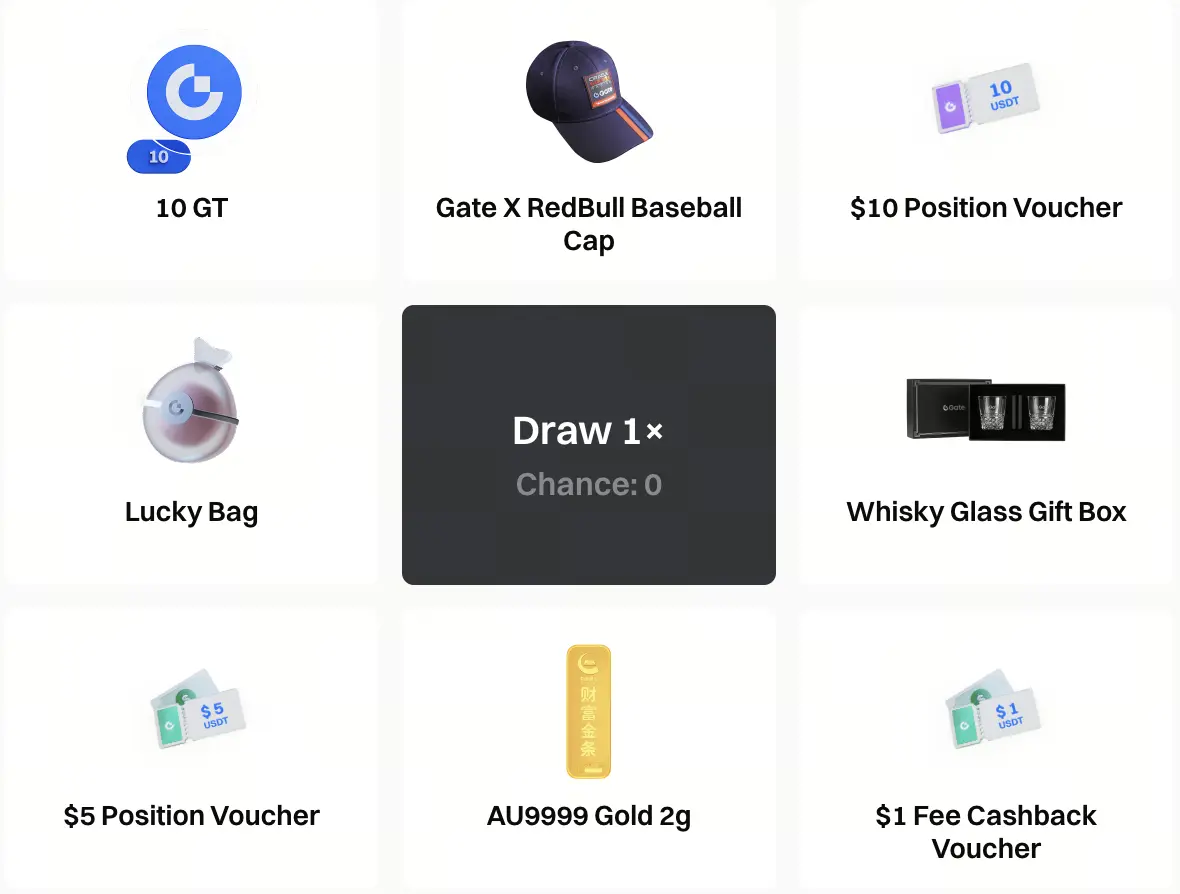
Featured prizes this round:
🎁 10 GT
🎁 2g Gold
🎁 Whiskey Glass Gift Box
🎁 Gate × Red Bull Cap
Plus position vouchers, fee rebate coupons, and token lucky bags are still dropping.
📌 Easy Heat Points today:
✔ Check in +1
✔ Visit Live page +5 (https://www.gate.com/live)
✔ First 5-minute watch +50
✔ Comment +10
✔ Share a stream +20
✔ Complete one copy trade +50
🎰 80 Heat Points = 1 Spin
The prize pool was just refilled — join early for a better chance 👀
👉 https://www.gate.com/activities/watch-to-earn?now_period=18
🎰 Watch-to-Earn Prize Carnival
Featured prizes this round:
🎁 10 GT
🎁 2g Gold
🎁 Whiskey Glass Gift Box
🎁 Gate × Red Bull Cap
Plus position vouchers, fee rebate coupons, and token lucky bags are still dropping.
📌 Easy Heat Points today:
✔ Check in +1
✔ Visit Live page +5 (https://www.gate.com/live)
✔ First 5-minute watch +50
✔ Comment +10
✔ Share a stream +20
✔ Complete one copy trade +50
🎰 80 Heat Points = 1 Spin
The prize pool was just refilled — join early for a better chance 👀
👉 https://www.gate.com/activities/watch-to-earn?now_period=18