Trade
Basic
Futures
Futures
Hundreds of contracts settled in USDT or BTC
TradFi
Gold
Trade global traditional assets with USDT in one place
Options
Hot
Trade European-style vanilla options
Unified Account
Maximize your capital efficiency
Demo Trading
Futures Kickoff
Get prepared for your futures trading
Futures Events
Participate in events to win generous rewards
Demo Trading
Use virtual funds to experience risk-free trading
Earn
Launch
CandyDrop
Collect candies to earn airdrops
Launchpool
Quick staking, earn potential new tokens
HODLer Airdrop
Hold GT and get massive airdrops for free
Launchpad
Be early to the next big token project
Alpha Points
Trade on-chain assets and enjoy airdrop rewards!
Futures Points
Earn futures points and claim airdrop rewards
Investment
Simple Earn
Earn interests with idle tokens
Auto-Invest
Auto-invest on a regular basis
Dual Investment
Buy low and sell high to take profits from price fluctuations
Soft Staking
Earn rewards with flexible staking
Crypto Loan
0 Fees
Pledge one crypto to borrow another
Lending Center
One-stop lending hub
VIP Wealth Hub
Customized wealth management empowers your assets growth
Private Wealth Management
Customized asset management to grow your digital assets
Quant Fund
Top asset management team helps you profit without hassle
Staking
Stake cryptos to earn in PoS products
Smart Leverage
New
No forced liquidation before maturity, worry-free leveraged gains
GUSD Minting
Use USDT/USDC to mint GUSD for treasury-level yields
More
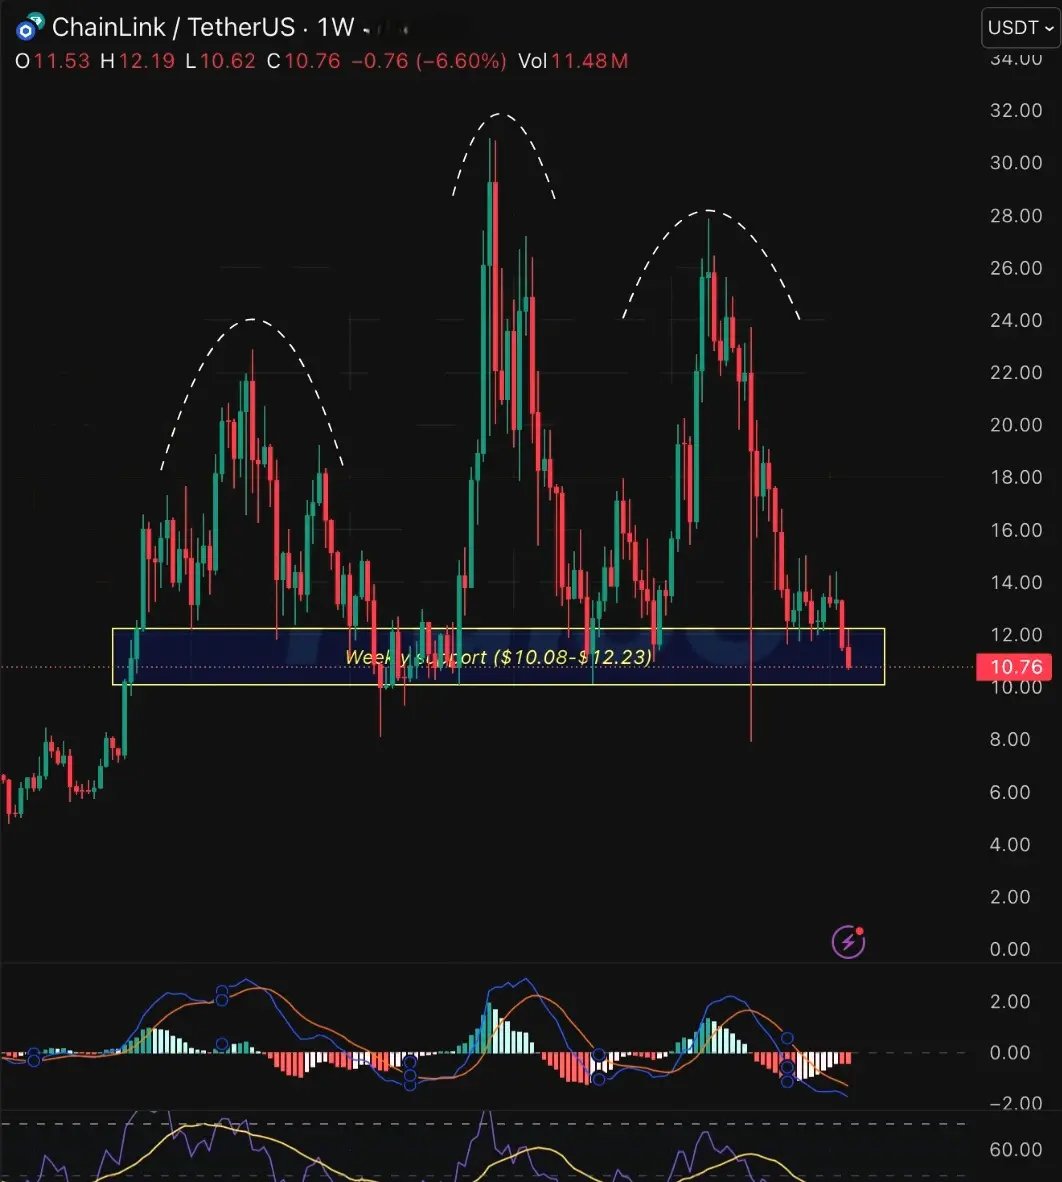
# LINKUSDT
7.16K
BasheerAlgundubi
#LINKUSDT – The next two weeks will determine the market direction.
On the weekly chart, $LINK stock forms a head and shoulders pattern with a neckline at the 10.08-12.23 dollar level, a classic reversal pattern from bullish to bearish.
If this neckline holds during the next two weeks, a rebound is likely. If it breaks, the trend reversal will be confirmed with a downside target near $8.
#PreciousMetalsPullBack
#Chainlink
#LINK
$LINK
LINK5,91%
- Reward
- 1
- 1
- Repost
- Share
BasheerAlgundubi:
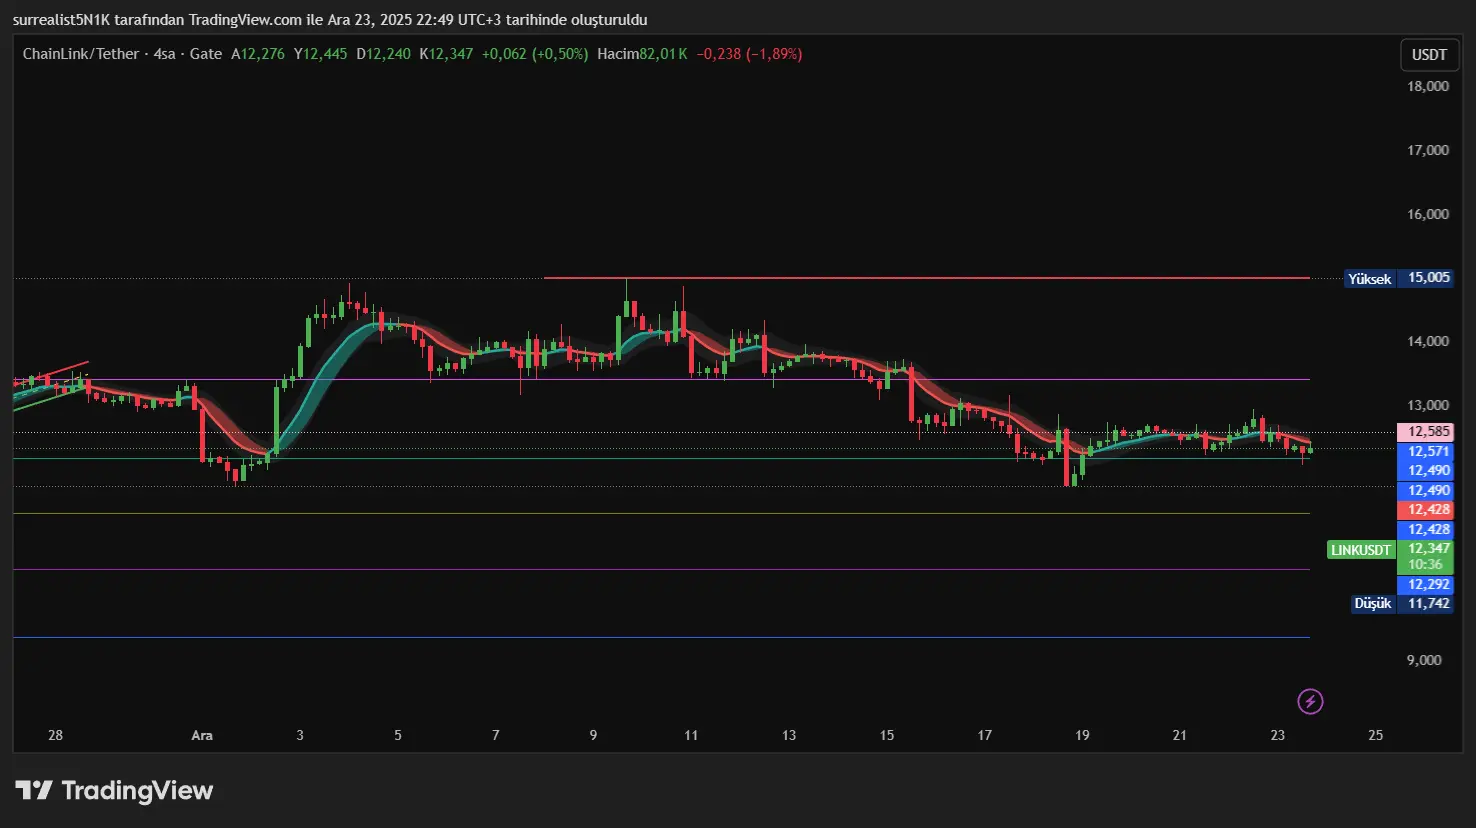
If this neckline holds during the next two weeks, a rebound is likely. However, if it breaks, a trend reversal will be confirmed with a downside target near $8.🔥 LINK / USDT – Clear Level Plan from a Trader's Perspective
LINK is currently stuck in the 12.30 - 12.60 range.
No trend, no momentum → it's basically a level trading market.
🔍 Key Technical Levels:
13.30 – 13.50: Main resistance
→ The long appetite is limited before a large volume breakout.
12.30 – 12.00: Main support / holding area
11.70: A signal of weakness and selling pressure
📉 Volume is decreasing → Breakout attempts are not providing confidence for now.
📌 Possible Scenarios:
Hold above 12.30 → Reaction rallies may be seen
Close above 13.50 → The structure strengthens, the
LINK5,91%
- Reward
- 17
- 12
- Repost
- Share
Falcon_Official :
:
Watching Closely 🔍️View More
Load More
Join 40M users in our growing community
⚡️ Join 40M users in the crypto craze discussion
💬 Engage with your favorite top creators
👍 See what interests you
Trending Topics
863 Popularity
796 Popularity
4.88K Popularity
107 Popularity
191 Popularity
215 Popularity
14.33K Popularity
13.17K Popularity
1.73K Popularity
9.64K Popularity
8.14K Popularity
2.5K Popularity
85 Popularity
28.6K Popularity
220.86K Popularity
News
View MoreSingapore's DBS Bank has upgraded its clearing network to support settlement services for stablecoins, enhancing the efficiency and security of digital currency transactions.
5 m
BitMart contracts will list ABNBUSDT.
7 m
Vitalik proposes a new creator token scheme, experts question: DAO governance issues may cause the plan to fail
10 m
DBS Bank received $5.85 million worth of Ethereum from Wintermute
12 m
Caixin: Reserve Bank of India proposes to promote "BRICS digital currency interconnection," planning to build a cross-border settlement "bridge" using consortium blockchain
13 m
Pin