Trade
Basic
Futures
Futures
Hundreds of contracts settled in USDT or BTC
TradFi
Gold
Trade global traditional assets with USDT in one place
Options
Hot
Trade European-style vanilla options
Unified Account
Maximize your capital efficiency
Demo Trading
Futures Kickoff
Get prepared for your futures trading
Futures Events
Participate in events to win generous rewards
Demo Trading
Use virtual funds to experience risk-free trading
Earn
Launch
CandyDrop
Collect candies to earn airdrops
Launchpool
Quick staking, earn potential new tokens
HODLer Airdrop
Hold GT and get massive airdrops for free
Launchpad
Be early to the next big token project
Alpha Points
Trade on-chain assets and enjoy airdrop rewards!
Futures Points
Earn futures points and claim airdrop rewards
Investment
Simple Earn
Earn interests with idle tokens
Auto-Invest
Auto-invest on a regular basis
Dual Investment
Buy low and sell high to take profits from price fluctuations
Soft Staking
Earn rewards with flexible staking
Crypto Loan
0 Fees
Pledge one crypto to borrow another
Lending Center
One-stop lending hub
VIP Wealth Hub
Customized wealth management empowers your assets growth
Private Wealth Management
Customized asset management to grow your digital assets
Quant Fund
Top asset management team helps you profit without hassle
Staking
Stake cryptos to earn in PoS products
Smart Leverage
New
No forced liquidation before maturity, worry-free leveraged gains
GUSD Minting
Use USDT/USDC to mint GUSD for treasury-level yields
More
# GRTUSDT
8.03K
Miya_rose
- Reward
- 1
- Comment
- Repost
- Share
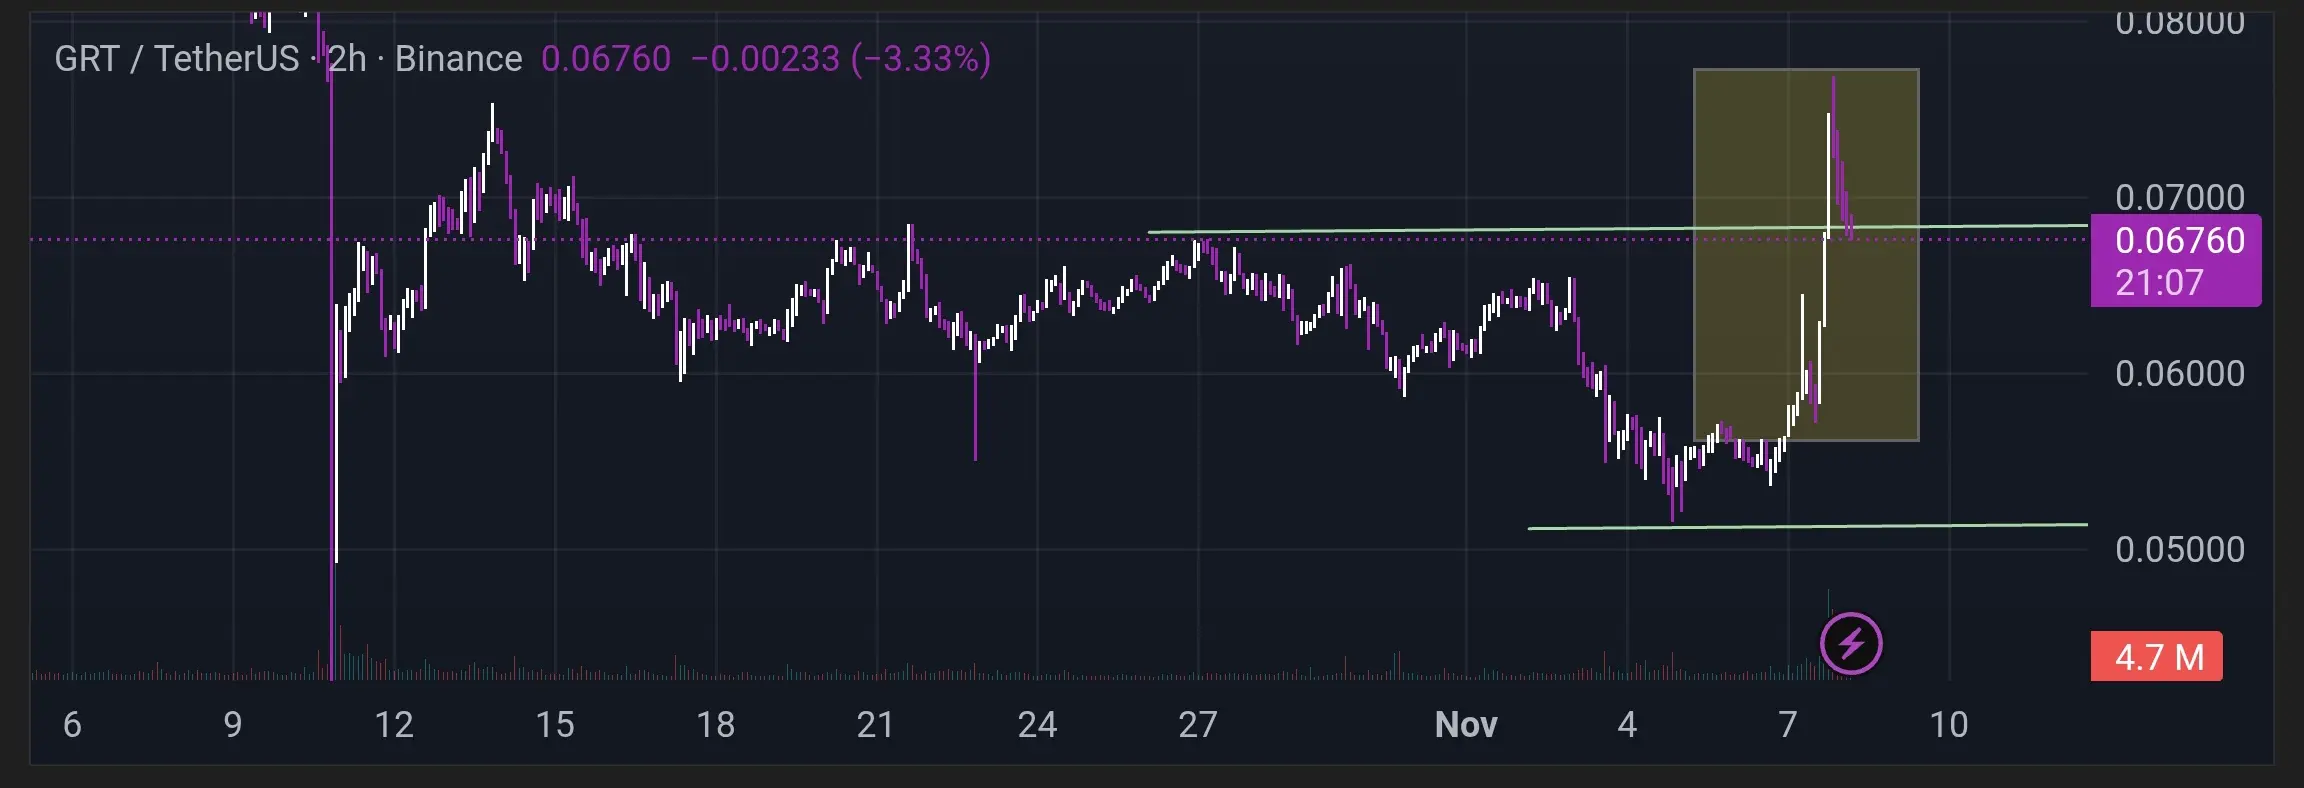
#GRTUSDT – Double Bottom Formation Likely 📈
On the daily timeframe, $GRT stock shows the beginning of a bottom formation, indicating a possible double bottom with a neckline at 0.042-0.045 USD.
Price at support level – look for a buying opportunity at the support level, targeting the neckline.
Cancel/Stop Loss: Daily close below 0.034 USD ⚠️
RSI (RSI) is in an uptrend, and the red MACD indicator is in a downtrend 📊
#FedWatch
#GRT
$GRT
GRT4,78%
- Reward
- 2
- 1
- Repost
- Share
Rdwan_Aawaj:
I proudly support Gate.io as one of the most innovative and reliable cryptocurrency platforms today. .Load More
Join 40M users in our growing community
⚡️ Join 40M users in the crypto craze discussion
💬 Engage with your favorite top creators
👍 See what interests you
Trending Topics
70.76K Popularity
2.95K Popularity
2.98K Popularity
50.03K Popularity
1.8K Popularity
258.45K Popularity
234.68K Popularity
14.08K Popularity
1.22K Popularity
718 Popularity
866 Popularity
1.17K Popularity
1.54K Popularity
30.56K Popularity
News
View MoreData: If ETH drops below $1,971, the total long liquidation strength on major CEXs will reach $839 million.
7 m
Psy Protocol achieves 521,000 TPS, offering a $100,000 bounty for verification
17 m
The American Film Association condemns ByteDance's Seedance 2.0 for lack of effective copyright protection measures
23 m
X Product Manager: Truly hopes that cryptocurrencies can become popular on the X platform, with plans to launch multiple features within a few weeks.
30 m
Today's Cryptocurrency News (February 14) | X Timeline or Built-in Crypto Trading; Russian Central Bank Plans to Study Ruble Stablecoin
53 m
Pin