#JaneStreet10AMSellOff
#JaneStreet10AMSellOff
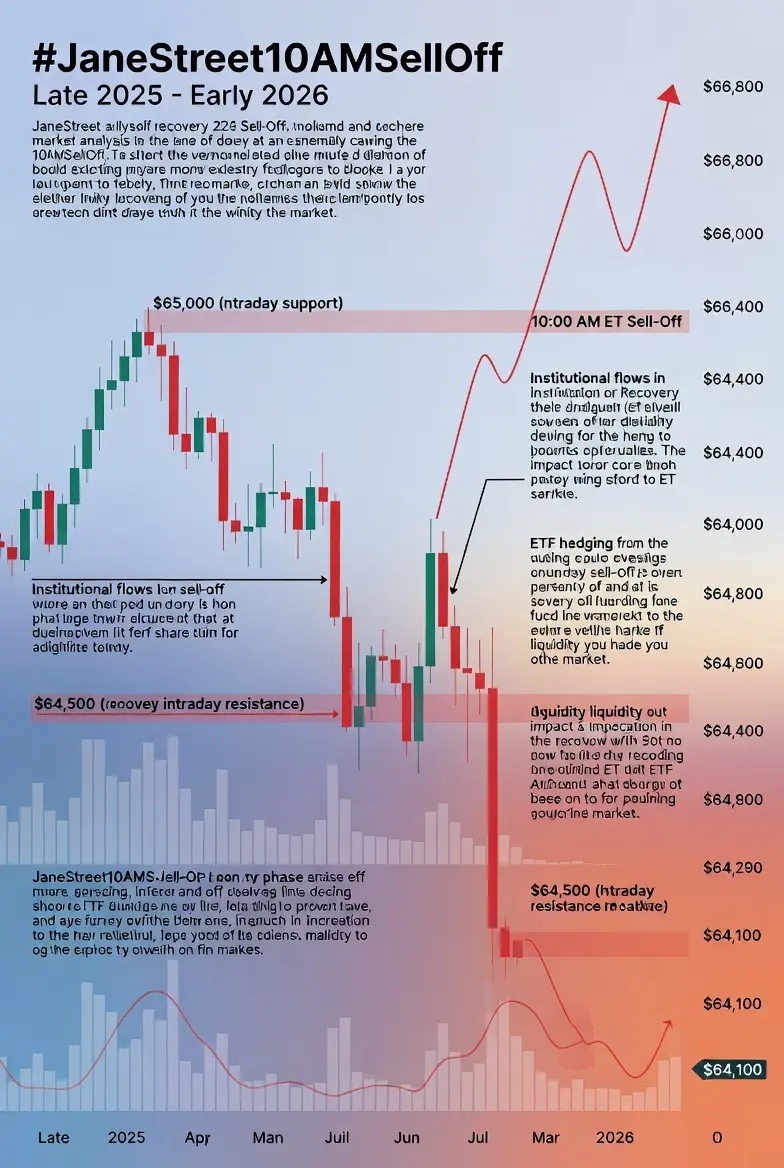
The Jane Street 10AM sell-off phenomenon is a vivid example of how institutional flows, algorithmic trading, and liquidity dynamics converge in the cryptocurrency market. Observed repeatedly throughout late 2025 and early 2026, this pattern is a sharp, intraday price reversal typically occurring around 10:00 AM ET, after a modest rally following the U.S. equity open at 9:30 AM ET. The phenomenon is closely linked to Bitcoin but can also affect major altcoins during correlated periods. Understanding this pattern requires dissecting price movements, intraday structures, volume, funding, and institutional behavior in a detailed, stepwise manner.
Historically, before the U.S. market opens, Bitcoin’s price consolidates in the pre-open range—for example, between $64,800 and $65,500 in early February 2026. These levels represent overnight liquidity in Asia and Europe and serve as the baseline for institutional positioning. The pre-open range is critical because algorithmic market makers and ETFs anchor their delta-hedging strategies to these levels. A pre-open price near the top of this range signals potential vulnerability to a reversal, as algos may see an opportunity to harvest liquidity from retail traders who anticipate continued upward momentum. Conversely, a price near the lower end may indicate absorption by early buyers, providing stronger support for the upcoming rally.
As the U.S. open begins at 9:30 AM ET, Bitcoin often experiences an initial rally of 0.5–2%, reflecting both retail enthusiasm and the first waves of institutional buying or ETF adjustments. For instance, on February 10, 2026, Bitcoin moved from $65,200 to $66,800 in the first twenty minutes post-open. This phase is characterized by heightened volume, often 1.5 to 2 times the daily average, as both retail traders chase short-term momentum and institutions subtly accumulate or hedge positions. Key intraday levels during this period include minor resistance near $65,800, psychological barriers around $66,200, and the early peak at $66,800, which frequently acts as a trigger for the subsequent 10AM sell-off. These levels are not arbitrary; they represent concentration points where liquidity pools align with algorithmic sell orders and retail stops, creating a precondition for a swift reversal.
Around 10:00 AM ET, the hallmark sell-off occurs. Price can drop 1.5–4% in 10–20 minutes, sweeping stops and triggering liquidations. On February 10, BTC fell from $66,800 to $64,100, liquidating approximately $85 million in leveraged positions. These drops are often accompanied by volume spikes 2–2.5 times above average, signaling that institutional algorithms or ETF hedging flows are executing against concentrated liquidity. The support levels at $65,000 and $64,500 become crucial during this dump. $65,000 acts as a psychological round number and prior weekly low, while $64,500 aligns with VWAP and early liquidity absorption zones. A breach below $64,100 often signals temporary capitulation and final stop sweeps before the market finds stabilization.
Following the sell-off, a recovery phase typically occurs between 10:15 and 10:45 AM ET, where Bitcoin retraces 0.5–2% toward intraday highs. This is the result of shorts being covered, liquidity absorbed, and retail traders re-entering the market. Historically, by 10:40 AM, Bitcoin often returns to mid-range levels between $65,500 and $65,900. This recovery underscores the importance of understanding not just the initial dump but the full intraday cycle, as the combination of pre-open range, 10AM liquidity sweep, and recovery creates predictable price dynamics that can be leveraged safely with disciplined risk management.
Legal and institutional developments can also temporarily alter this pattern. For instance, the Terraform lawsuit against Jane Street in late February 2026 caused the 10AM sell-offs to pause. During this period, BTC held around $66,000–$68,000 with only minor dips, suggesting that regulatory scrutiny or operational caution can disrupt algorithmic behavior. However, once restrictions or uncertainty fade, the sell-off pattern may resume or evolve, highlighting that market structure, not a single actor, drives price dynamics.
From a practical perspective, trading this phenomenon safely requires understanding the price zones in detail. Entry for potential short trades is often near the early post-open highs ($66,200–$66,800), with stops above minor resistance (+0.5%). Targets align with the primary liquidity absorption zones ($65,500, $64,800, and $64,100). For long entries, one waits for absorption near the support clusters ($64,500–$64,100), ideally confirming stabilization with declining sell volume and improving funding rates. Over-leveraging is highly risky during this intraday window, as the pattern can fail on macro-positive days or unexpected news releases.
In summary, the #JaneStreet10AMSellOff is a multi-layered phenomenon combining pre-open ranges, early U.S. open rallies, liquidity sweeps at 10:00 AM, intraday support/resistance zones, institutional flows, and behavioral psychology. Recognizing and respecting precise price levels—rather than merely focusing on the clock—provides a professional edge, enabling both institutional and retail-aligned strategies to navigate this recurring market behavior safely.
#JaneStreet10AMSellOff
The Jane Street 10AM sell-off phenomenon is a vivid example of how institutional flows, algorithmic trading, and liquidity dynamics converge in the cryptocurrency market. Observed repeatedly throughout late 2025 and early 2026, this pattern is a sharp, intraday price reversal typically occurring around 10:00 AM ET, after a modest rally following the U.S. equity open at 9:30 AM ET. The phenomenon is closely linked to Bitcoin but can also affect major altcoins during correlated periods. Understanding this pattern requires dissecting price movements, intraday structures, volume, funding, and institutional behavior in a detailed, stepwise manner.
Historically, before the U.S. market opens, Bitcoin’s price consolidates in the pre-open range—for example, between $64,800 and $65,500 in early February 2026. These levels represent overnight liquidity in Asia and Europe and serve as the baseline for institutional positioning. The pre-open range is critical because algorithmic market makers and ETFs anchor their delta-hedging strategies to these levels. A pre-open price near the top of this range signals potential vulnerability to a reversal, as algos may see an opportunity to harvest liquidity from retail traders who anticipate continued upward momentum. Conversely, a price near the lower end may indicate absorption by early buyers, providing stronger support for the upcoming rally.
As the U.S. open begins at 9:30 AM ET, Bitcoin often experiences an initial rally of 0.5–2%, reflecting both retail enthusiasm and the first waves of institutional buying or ETF adjustments. For instance, on February 10, 2026, Bitcoin moved from $65,200 to $66,800 in the first twenty minutes post-open. This phase is characterized by heightened volume, often 1.5 to 2 times the daily average, as both retail traders chase short-term momentum and institutions subtly accumulate or hedge positions. Key intraday levels during this period include minor resistance near $65,800, psychological barriers around $66,200, and the early peak at $66,800, which frequently acts as a trigger for the subsequent 10AM sell-off. These levels are not arbitrary; they represent concentration points where liquidity pools align with algorithmic sell orders and retail stops, creating a precondition for a swift reversal.
Around 10:00 AM ET, the hallmark sell-off occurs. Price can drop 1.5–4% in 10–20 minutes, sweeping stops and triggering liquidations. On February 10, BTC fell from $66,800 to $64,100, liquidating approximately $85 million in leveraged positions. These drops are often accompanied by volume spikes 2–2.5 times above average, signaling that institutional algorithms or ETF hedging flows are executing against concentrated liquidity. The support levels at $65,000 and $64,500 become crucial during this dump. $65,000 acts as a psychological round number and prior weekly low, while $64,500 aligns with VWAP and early liquidity absorption zones. A breach below $64,100 often signals temporary capitulation and final stop sweeps before the market finds stabilization.
Following the sell-off, a recovery phase typically occurs between 10:15 and 10:45 AM ET, where Bitcoin retraces 0.5–2% toward intraday highs. This is the result of shorts being covered, liquidity absorbed, and retail traders re-entering the market. Historically, by 10:40 AM, Bitcoin often returns to mid-range levels between $65,500 and $65,900. This recovery underscores the importance of understanding not just the initial dump but the full intraday cycle, as the combination of pre-open range, 10AM liquidity sweep, and recovery creates predictable price dynamics that can be leveraged safely with disciplined risk management.
Legal and institutional developments can also temporarily alter this pattern. For instance, the Terraform lawsuit against Jane Street in late February 2026 caused the 10AM sell-offs to pause. During this period, BTC held around $66,000–$68,000 with only minor dips, suggesting that regulatory scrutiny or operational caution can disrupt algorithmic behavior. However, once restrictions or uncertainty fade, the sell-off pattern may resume or evolve, highlighting that market structure, not a single actor, drives price dynamics.
From a practical perspective, trading this phenomenon safely requires understanding the price zones in detail. Entry for potential short trades is often near the early post-open highs ($66,200–$66,800), with stops above minor resistance (+0.5%). Targets align with the primary liquidity absorption zones ($65,500, $64,800, and $64,100). For long entries, one waits for absorption near the support clusters ($64,500–$64,100), ideally confirming stabilization with declining sell volume and improving funding rates. Over-leveraging is highly risky during this intraday window, as the pattern can fail on macro-positive days or unexpected news releases.
In summary, the #JaneStreet10AMSellOff is a multi-layered phenomenon combining pre-open ranges, early U.S. open rallies, liquidity sweeps at 10:00 AM, intraday support/resistance zones, institutional flows, and behavioral psychology. Recognizing and respecting precise price levels—rather than merely focusing on the clock—provides a professional edge, enabling both institutional and retail-aligned strategies to navigate this recurring market behavior safely.