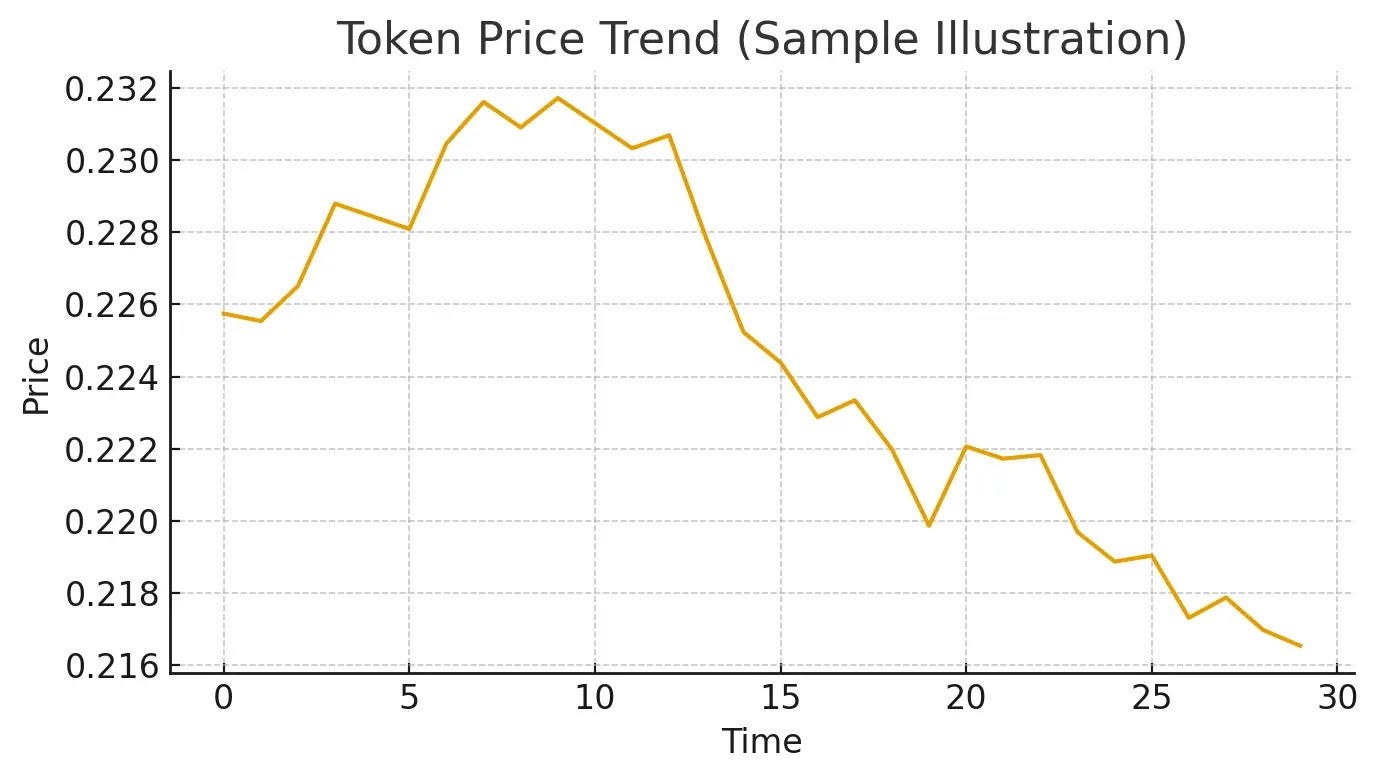
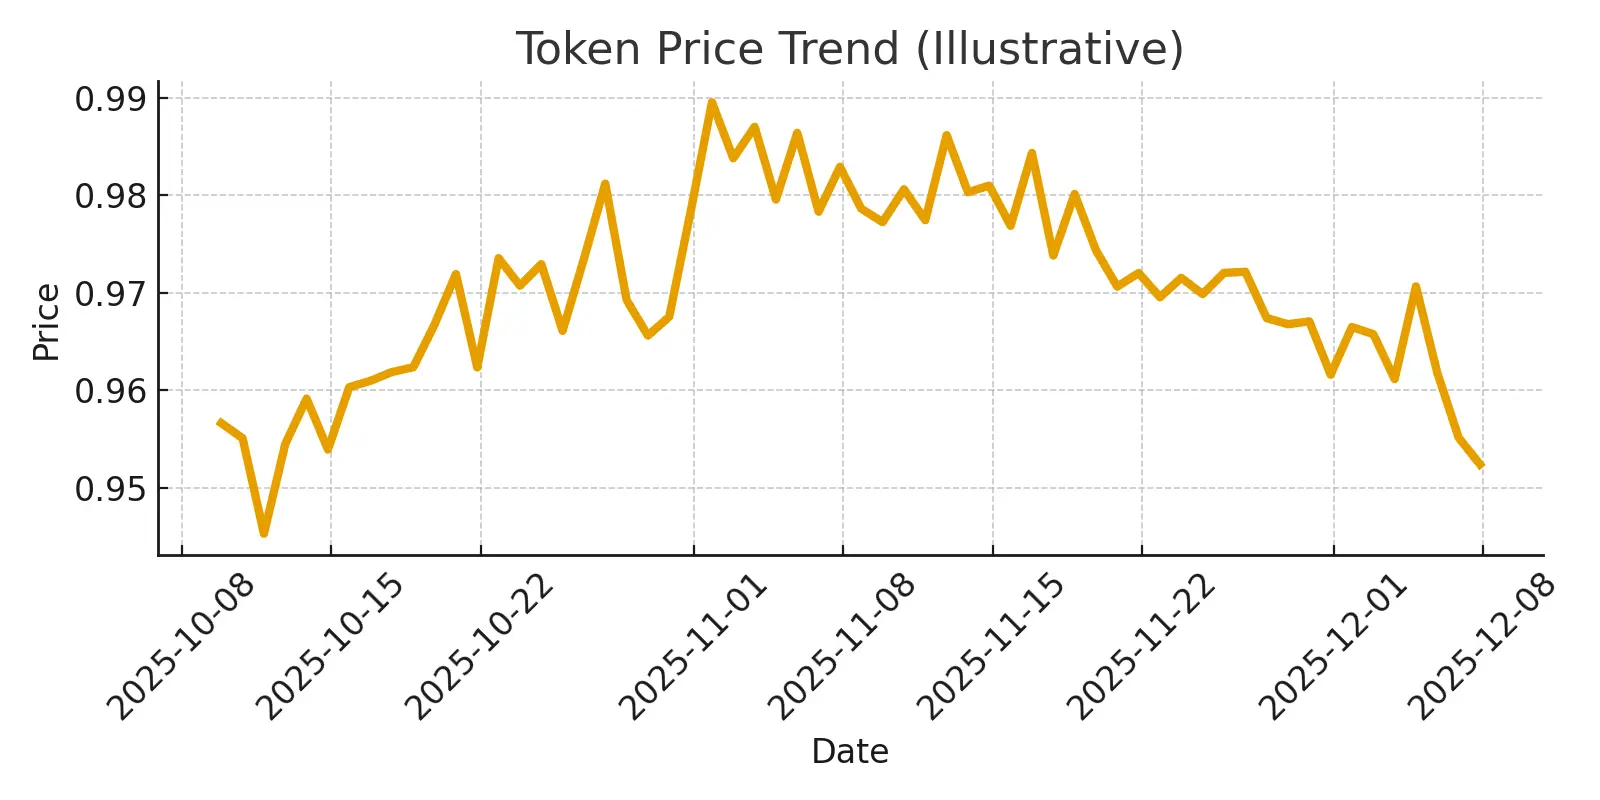
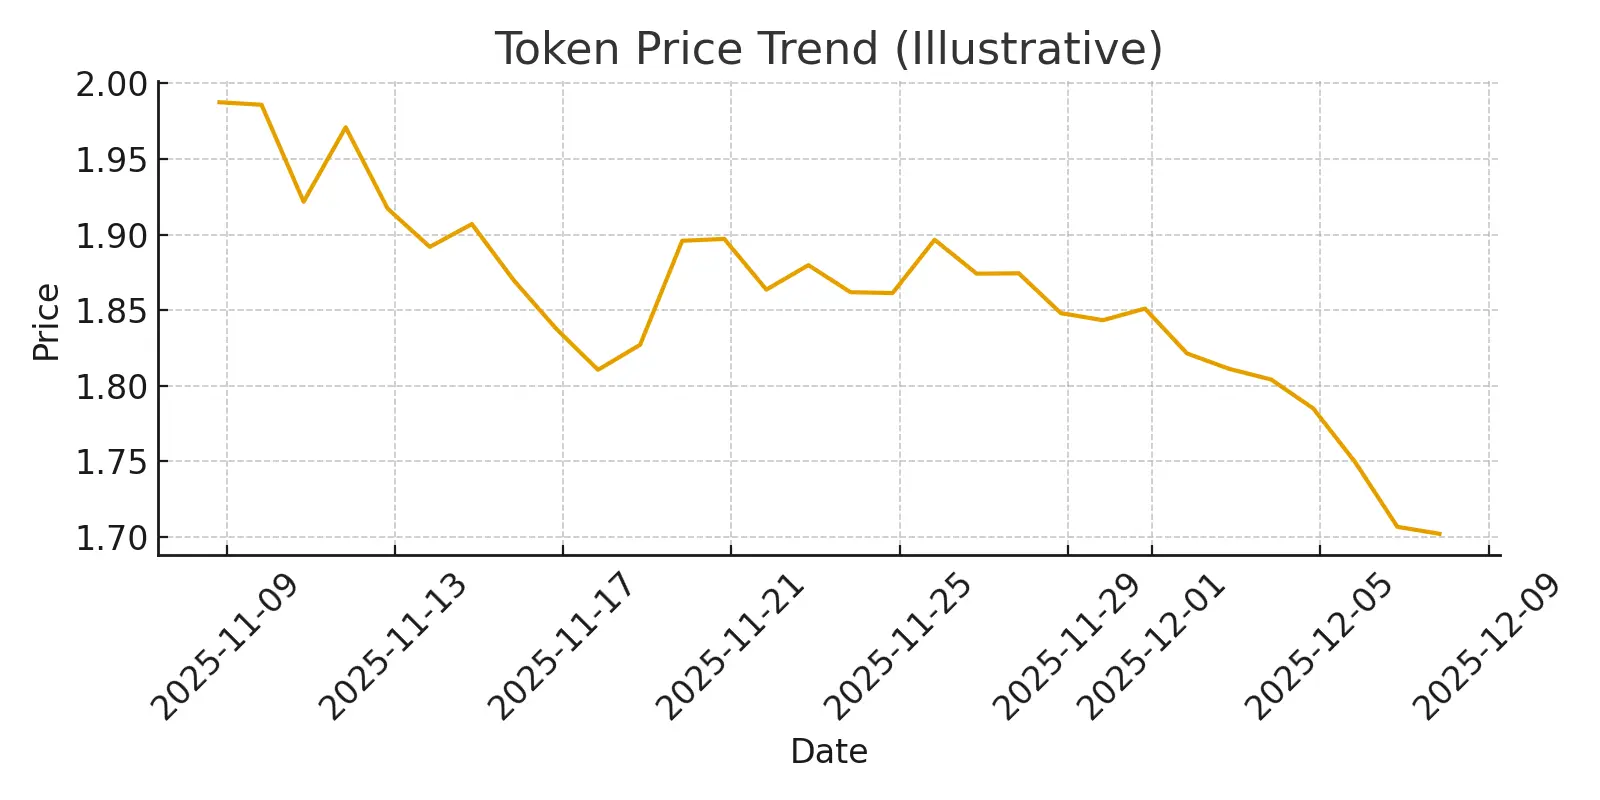
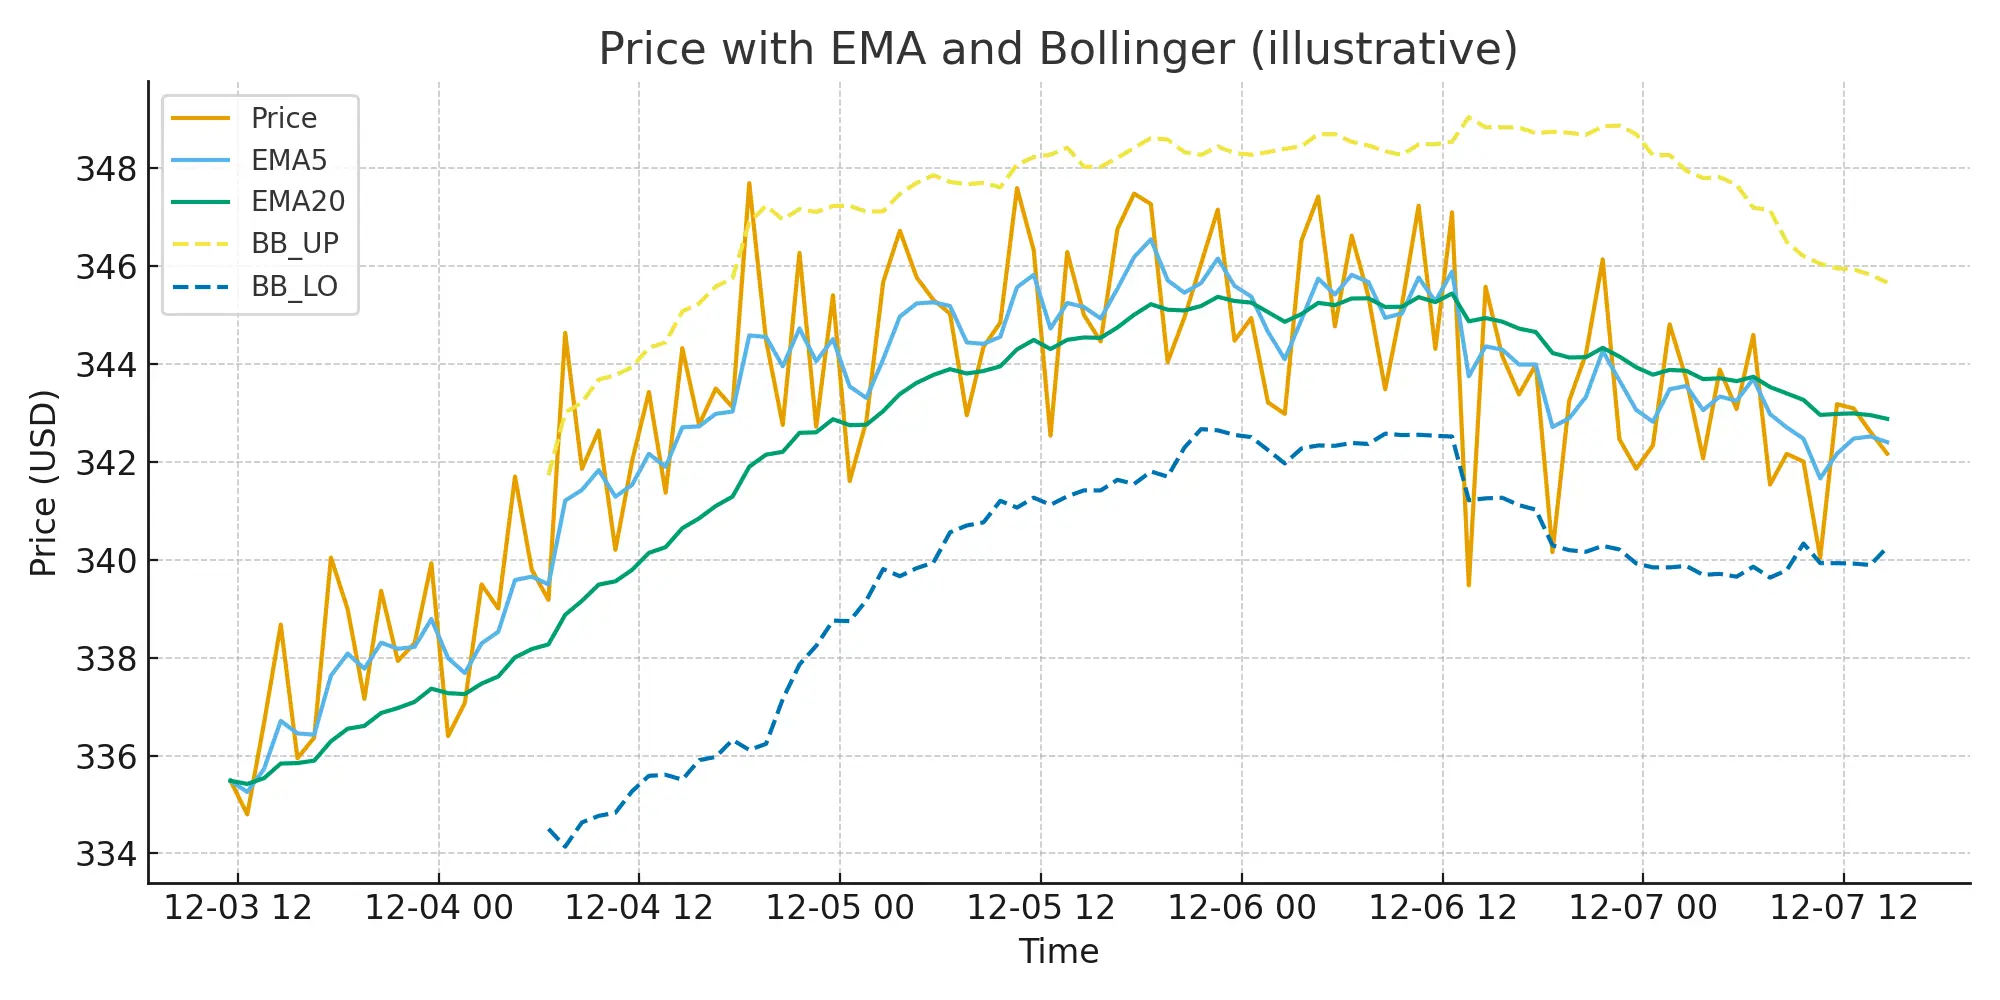
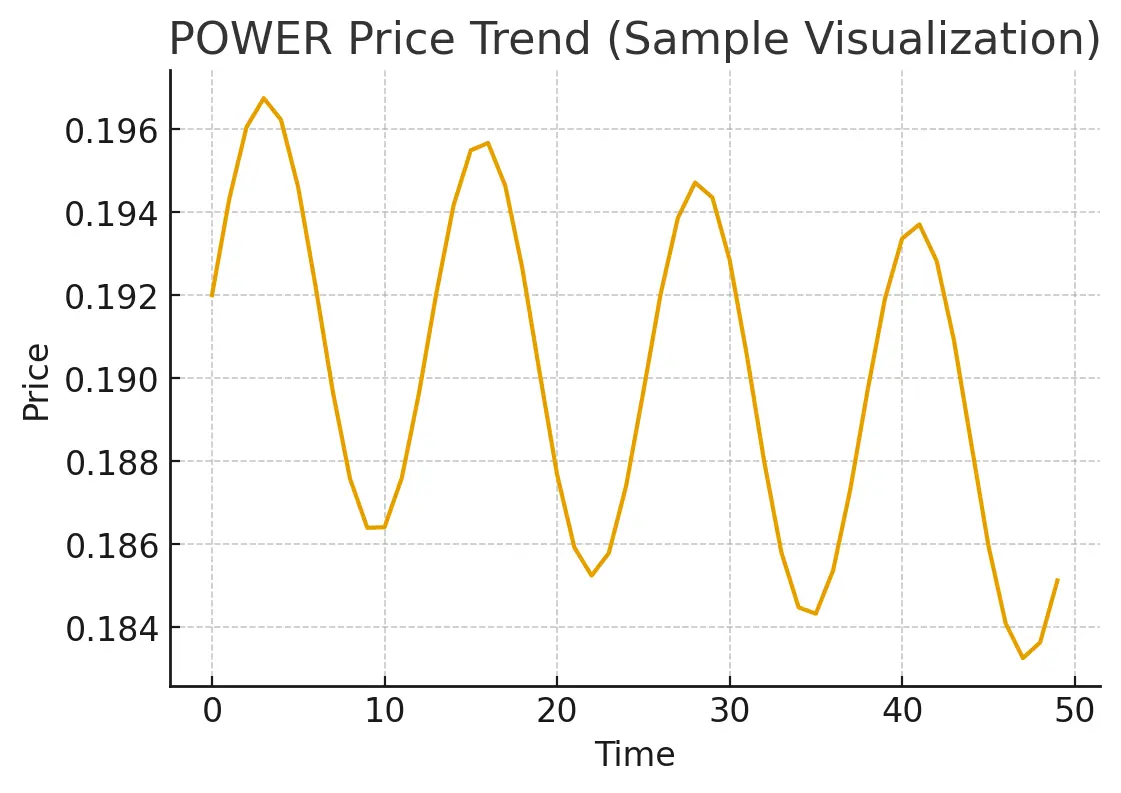
UnlimitedCryptoTrading
vip
Market Analyst
Crypto Market Researcher
Futures Trading Strategist
No content yet
📌 $MOODENG ‌ Market Analysis & Short-Term Outlook
The token just had a massive spike, shooting up sharply before cooling down into a tighter range. After the big wick, the price is stabilizing above the earlier support zone, which is a good sign that buyers are still active.
🔍 Current Trend
Price is holding around a new short-term base.
MACD is recovering from the downside momentum, showing early signs of a possible reversal.
RSI is in a neutral-to-bullish zone, meaning the market still has room to move.
📈 Future Prediction (Simple View)
If the token can hold above its current support and
MOODENG-17.07%
post-image
post-image
  • Reward
  • 2
  • Repost
  • Share
BeautifulDayvip:
Watching Closely 🔍
View More
$ASTER ‌Market Update – ASTER
The token has been moving inside a clear downtrend on the 1H chart, but the latest candles show some early signs of recovery. Buyers stepped in near the 0.88–0.90 area, which is holding as a short-term support.
RSI is climbing from the oversold zone, and MACD is gradually turning upward. This usually signals that momentum is trying to shift. If the price can stay above 0.95 and break the 0.98–1.00 zone, we may see a slow trend reversal on shorter timeframes.
From a broader view, the trend is still weak, so any recovery needs confirmation.
I refined the outlook us
ASTER-4.01%
post-image
post-image
  • Reward
  • 1
  • Repost
  • Share
User_MVSvip:
Looks like we've found the bottom, what do you think?
$FHE ‌Market Update on FHE/USDT
FHE just made a huge breakout after staying flat for a long time. The strong 1H candle pushed the price up sharply, showing clear buying pressure. Even after the spike, the chart is still holding above short-term moving averages, which means momentum hasn’t fully cooled off yet.
Short-Term View (1H)
Trend is still bullish as long as price stays above the recent support around the mid-0.02 range.
Momentum indicators show cooling, but buyers are still active.
Mid-Term View
Using simple EMA analysis, the trend is still pointing upward. If the pullback stays contro
FHE137.38%
post-image
post-image
  • Reward
  • 1
  • Repost
  • Share
BeautifulDayvip:
Watching Closely 🔍
$HYPE ‌Market Update & Short-Term View
The token has been under pressure after touching the 31+ zone, pulling back toward the 28 area before showing a small recovery. On the 1H chart, the price is still below most moving averages, which confirms a short-term downtrend. MACD is trying to flatten out, showing early signs of momentum slowing. RSI is sitting in the mid-range, meaning neither overbought nor oversold right now.
To refine the outlook, I checked different timeframes:
1H timeframe: trend still weak but stabilizing.
4H timeframe: momentum still bearish, but candles are trying to form a
HYPE-2.16%
post-image
post-image
  • Reward
  • Comment
  • Repost
  • Share
$XRP ‌Token Market Update
The token has shown a steady rebound after tapping the 1.98 zone, pushing back toward the 2.08+ level. Short-term momentum indicators are finally turning positive, and buyers seem to be taking control again.
Using multiple timeframes, the structure looks like this:
1-Hour View:
Price is climbing above short EMAs, showing early recovery signs. Momentum is shifting upward, and volatility is expanding again after a period of compression.
4-Hour View:
Still in a broader correction, but the market is attempting to build a higher low. A breakout above the recent 2.11 resis
XRP1.71%
post-image
post-image
  • Reward
  • 1
  • Repost
  • Share
BeautifulDayvip:
Watching Closely 🔍
$SOL ‌🟣 SOL Market Analysis – Quick View & Simple Future Outlook
SOL is showing a steady attempt to recover after the recent correction. Price is currently hovering around the mid-range, where buyers are slowly stepping back in. The 1-hour chart shows a clear bounce from the lower support zone, signaling that short-term momentum is improving.
🔍 What I’m Seeing Right Now
Momentum indicators are turning upward.
Price is reclaiming the shorter moving averages.
Volatility narrowed earlier but is now expanding again, which usually brings a directional move.
📌 Short-Term Prediction (1H Outlook)
SOL0.64%
post-image
post-image
  • Reward
  • Comment
  • Repost
  • Share
$ZEC ‌ZEC quick view — keeping it simple:
Price is around $339. Recent action shows a tight range between the recent high and low, and momentum is mixed. Short-term (1H): expect range-bound moves — watch for a clean EMA5 cross above EMA20 for a small push up. Medium-term (4H): if MACD shows a sustained bullish cross and volume follows, a breakout toward the recent highs is possible. Longer-term: neutral until a clear trend forms — manage risk and keep stops tight.
Prediction refinement (methods/timeframes)
Short (1H): range trade. Entry near support, small target near resistance; stop if pric
ZEC4.6%
post-image
post-image
  • Reward
  • Comment
  • Repost
  • Share
$FHE ‌The chart shows a strong breakout on the 1H timeframe. After spending a long period in a tight range, the candle structure finally pushed upward with heavy volume, and momentum indicators support the move.
RSI is sitting in the overbought zone, which means buyers are still in control but may cool off before another leg.
MACD shows a fresh bullish expansion, confirming that momentum is still strong.
Future Outlook (Personal Opinion, Not Advice)
If the trend holds above the recent breakout level, the move may continue with higher highs.
If price pulls back, watching the mid-range area and
FHE137.38%
post-image
post-image
  • Reward
  • Comment
  • Repost
  • Share
$POWER ‌📊 POWER Market Update — Quick Analysis & Short-Term Outlook
The chart shows that POWER is cooling down after yesterday’s strong volatility. On the 15-minute timeframe, price is moving below the short-term moving averages, which usually signals a temporary slowdown. The Bollinger Bands are tightening too — a sign that a breakout may be coming soon.
Momentum Check
MACD is still under the signal line, meaning buyers haven’t taken control yet.
RSI is sitting near the lower-mid zone, showing the market isn’t oversold but still leaning weak.
KDJ is flattening, hinting that we may see a sma
post-image
post-image
  • Reward
  • Comment
  • Repost
  • Share
$PIPPIN ‌Quick snapshot — token currently around $0.70 after breaking toward the upper Bollinger band. Short-term momentum is strong (MACD turned positive, KDJ/RSI elevated), so expect continued choppy gains if support holds near recent MAs.
Short-term (1H): Bullish momentum — look for pullbacks to the 5–20 MA cluster for entries.
Medium-term (1D): Trend looks constructive — a confirmed close above recent highs could target ~$0.85–0.95, but watch volume.
Long-term: Still speculative — keep risk tight and size positions accordingly.
Methods used: price action + moving averages, Bollinger band
PIPPIN6.77%
post-image
  • Reward
  • 1
  • Repost
  • Share
IDon'tDareToBeGreedyvip:
Isn't it bro 0.8-0.9?
$PIEVERSE ‌Quick snapshot — token currently around $0.70 after breaking toward the upper Bollinger band. Short-term momentum is strong (MACD turned positive, KDJ/RSI elevated), so expect continued choppy gains if support holds near recent MAs.
Short-term (1H): Bullish momentum — look for pullbacks to the 5–20 MA cluster for entries.
Medium-term (1D): Trend looks constructive — a confirmed close above recent highs could target ~$0.85–0.95, but watch volume.
Long-term: Still speculative — keep risk tight and size positions accordingly.
Methods used: price action + moving averages, Bollinger ban
PIEVERSE23.18%
post-image
post-image
  • Reward
  • Comment
  • Repost
  • Share
$FHE ‌FHE Market View | Momentum After Breakout
FHE recently showed strong upside momentum after a long quiet phase. The breakout was sharp, and now price is trying to settle above the previous range. This type of behavior usually tells us the market is deciding whether to continue or rest.
Short-Term View (1H):
Price is holding above fast EMA support
Momentum is still strong but slightly overheated
RSI is high, so short cooling or sideways action is healthy
A brief pause or pullback here wouldn’t be negative. It can help build strength.
Higher Timeframe View (4H):
Looking at the bigger pictu
FHE137.38%
post-image
post-image
  • Reward
  • Comment
  • Repost
  • Share
$MOODENG ‌MOODENG Market View | Short-term & Mid-term Outlook
MOODENG recently made a sharp move up, followed by healthy cooling. After such fast pumps, consolidation is normal. Right now, price is trying to build balance rather than rush higher again.
Short-Term View (1H):
Price is moving near short EMA support
Momentum is neutral after strong excitement cooling
RSI is stable, not overbought anymore
This suggests sideways movement or small fluctuations while the market decides the next direction.
Mid-Term View (4H):
On the higher timeframe, structure still looks constructive as long as price
MOODENG-17.07%
post-image
post-image
  • Reward
  • Comment
  • Repost
  • Share
$POWER ‌POWER Market View | Short-Term & Mid-Term Outlook
Current price action shows POWER cooling down after a strong recent push. On the 1H timeframe, price is moving below short-term moving averages, which tells me sellers are active right now. Momentum slowed after rejection near the recent high zone.
Short-Term View (1H):
Price is near a demand area where buyers previously stepped in
RSI is close to oversold, so a small bounce is possible
MACD still weak, meaning sideways or slow recovery is more likely than a fast pump
If buyers defend this zone, we may see a short relief move toward th
post-image
post-image
  • Reward
  • Comment
  • Repost
  • Share
$PI ‌Price dipped to ~0.218 after the last pullback, bounced to ~0.234 and is now trading near 0.222.
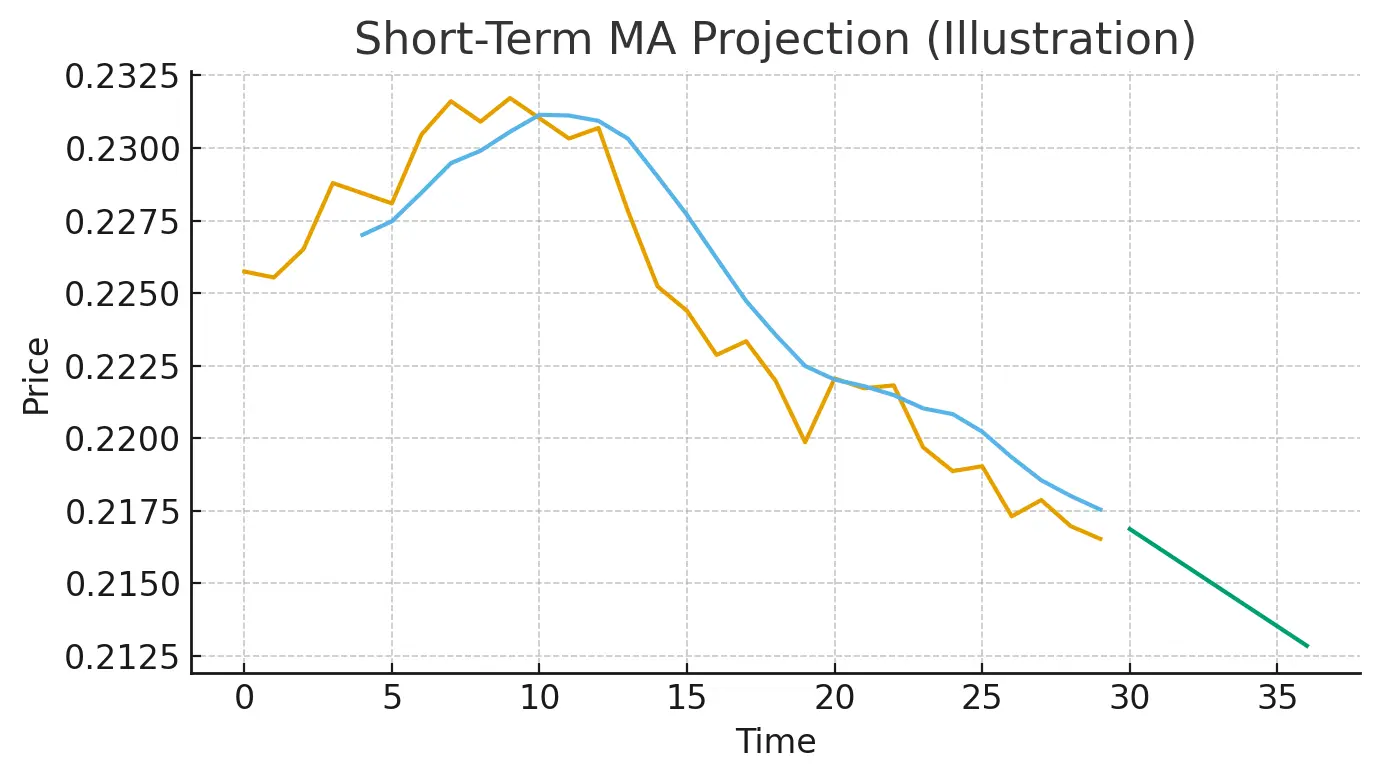
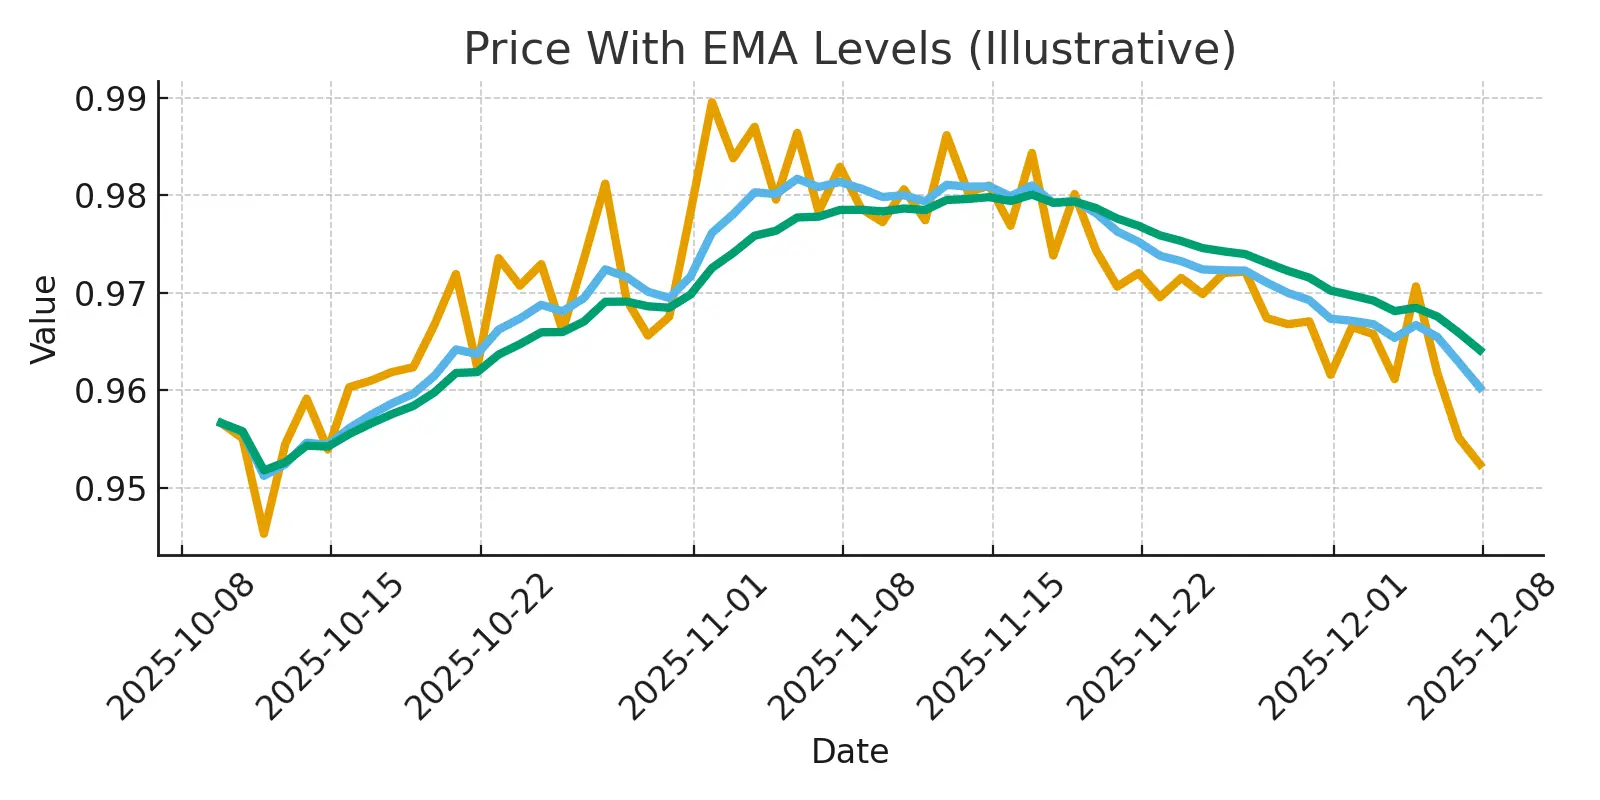
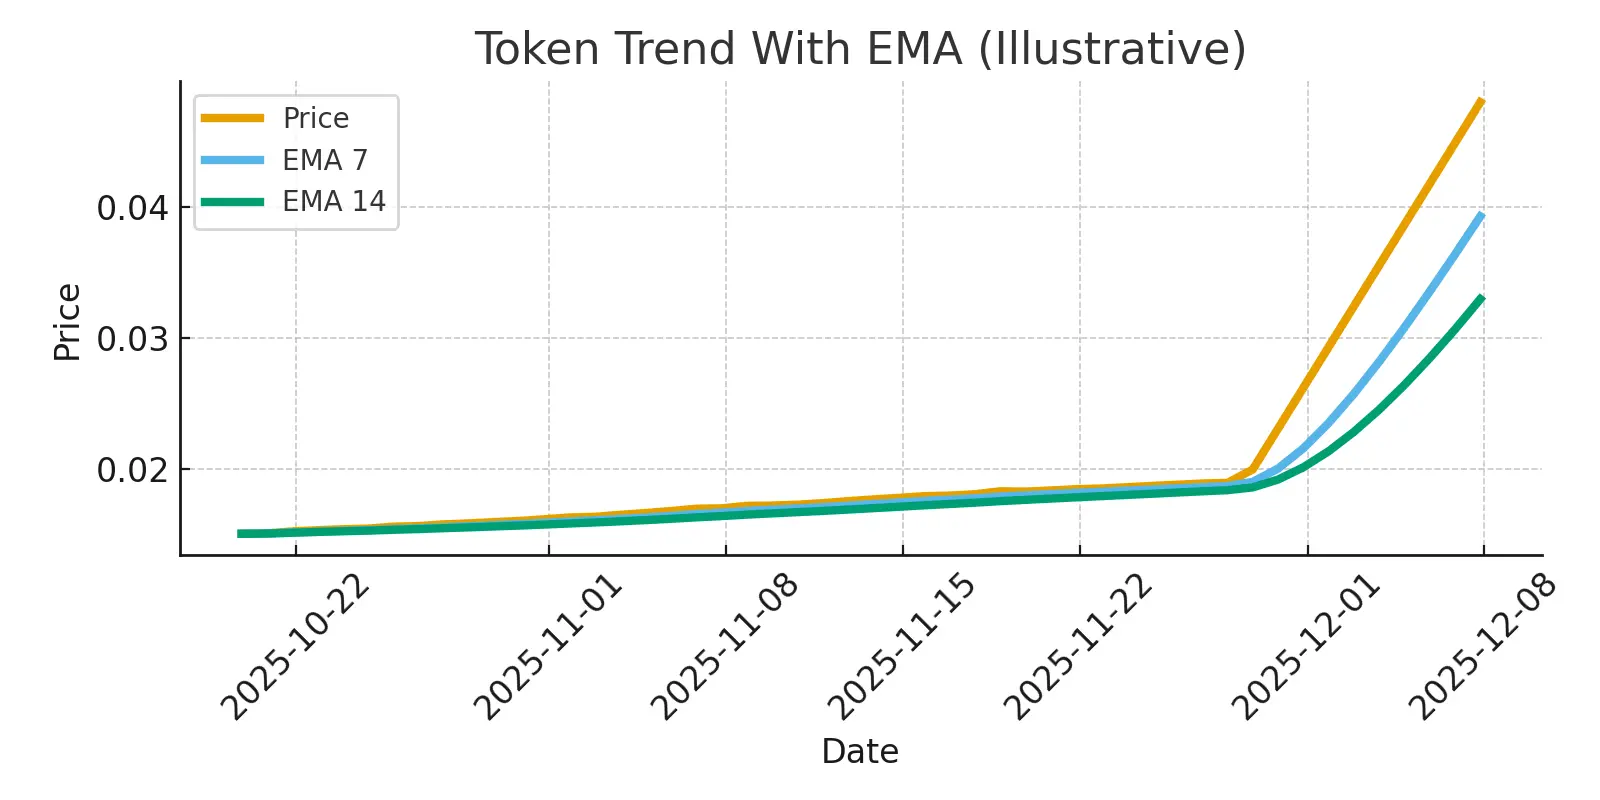
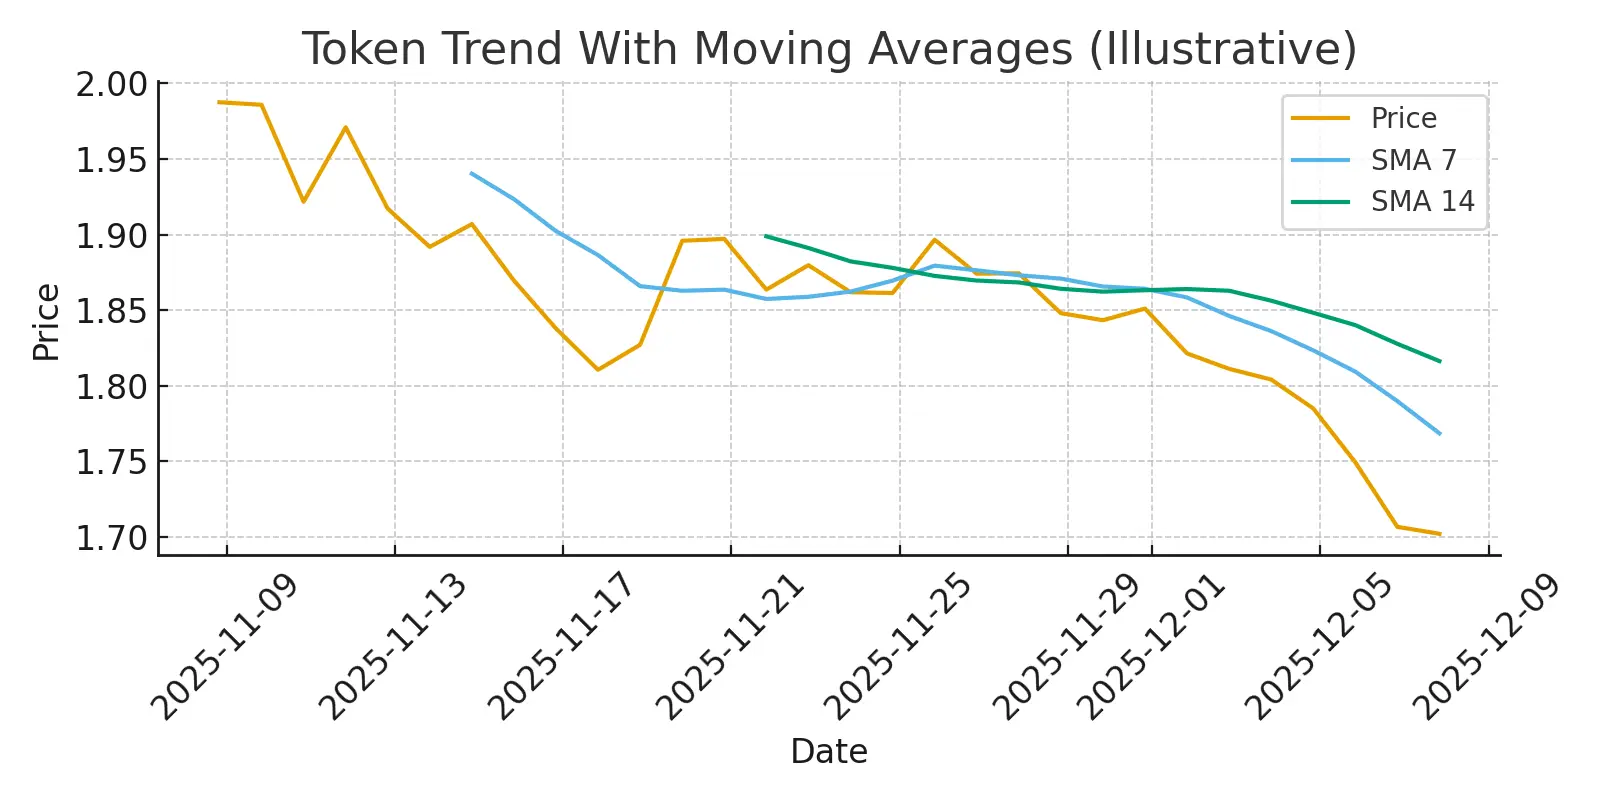
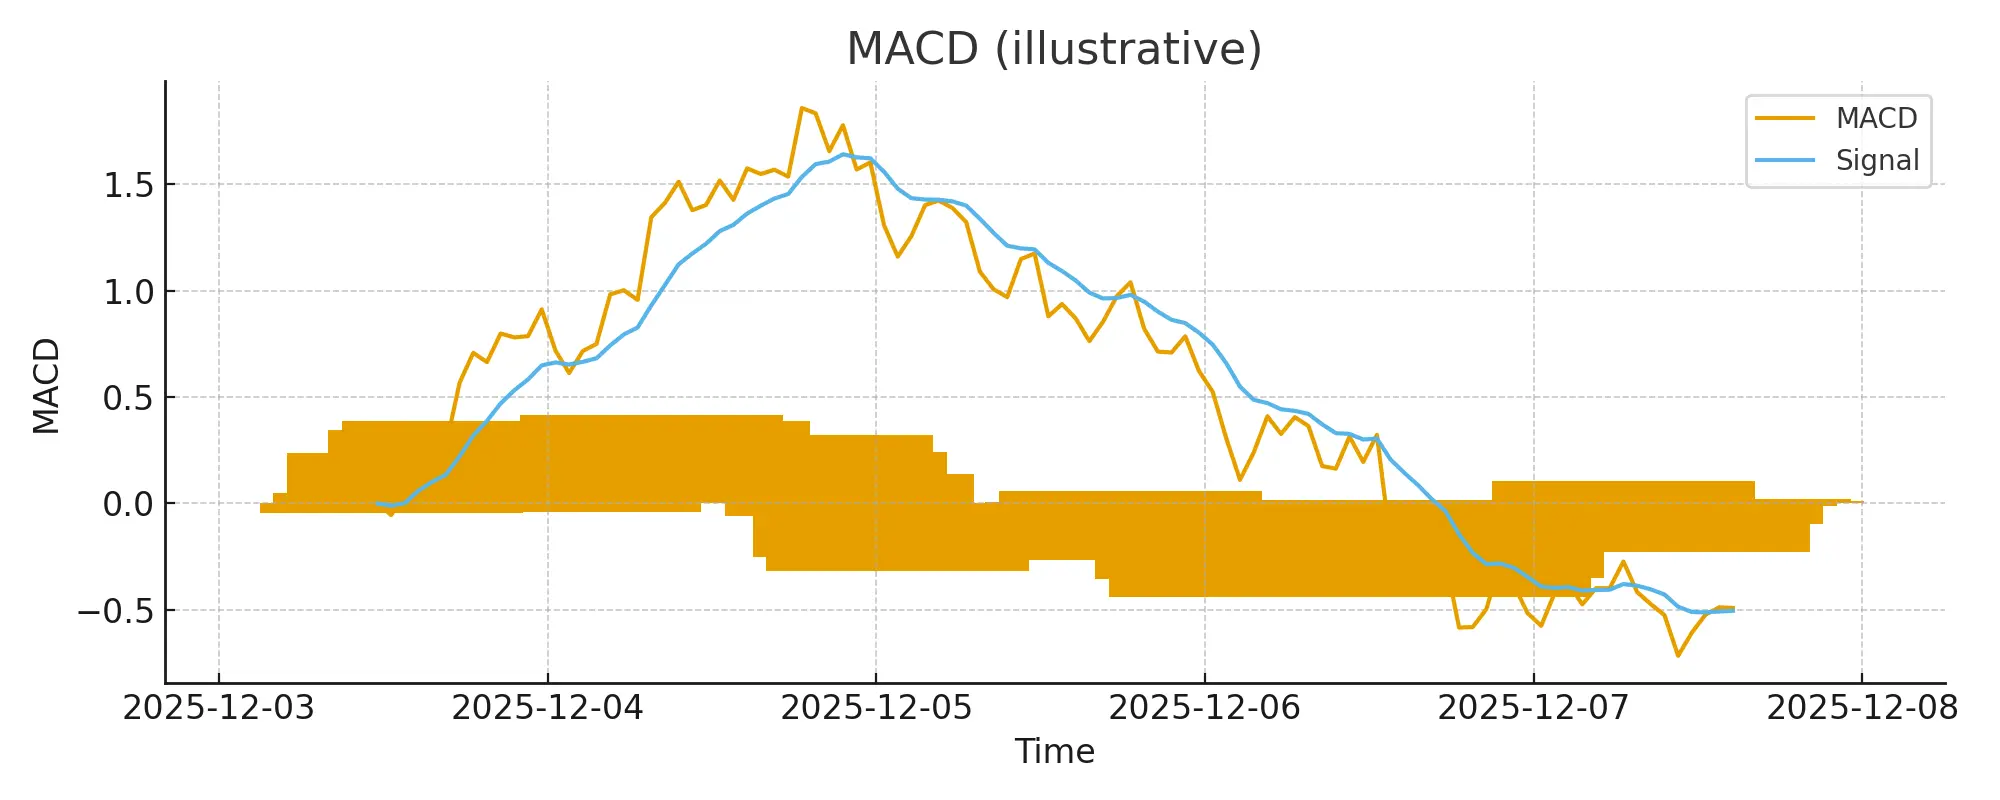
Short view: momentum is weak — watch the EMAs. If price holds above the EMA10 → small recovery likely to 0.226–0.230. If it closes below the 0.218 area again, another leg down is possible.
My view: small position, wait for clear confirmation or a clean retest. Not financial advice.
PI-0.72%
  • Reward
  • Comment
  • Repost
  • Share
📉 PI/USDT Market Update — Simple Breakdown
The market has been moving in a tight range, and PI is trying to hold above the 0.22 zone. Volume is steady, but momentum indicators are still mixed, which means the market hasn’t chosen a strong direction yet.
What I’m seeing now:
Price is mostly moving sideways after yesterday’s drop
RSI is sitting around the mid-40s → neither overbought nor oversold
MA lines are still close together → no strong trend yet
Small pullback pressure but buyers are defending the lower range
📌 Short-Term View
If the price can stay above 0.223, we might see another push
PI-0.72%
post-image
post-image
  • Reward
  • Comment
  • Repost
  • Share
PLANCK Market Update
PLANCK finally showed some strength after a long drop. Buyers stepped in near the bottom, and the price moved up smoothly, breaking back above the short-term moving averages. Momentum looks better now, and indicators are showing a healthier recovery.
On the 1H timeframe, the trend is climbing slowly. Pullbacks are light, and buyers are still active around the support zones.
On the 4H timeframe, the bigger trend is starting to shift from a downtrend to a possible early reversal. If the price holds above the recent support, it may continue this steady climb.
Short-Term: Mild
PLANCK-1.83%
post-image
post-image
  • Reward
  • Comment
  • Repost
  • Share
ELIZAOS Market Update
The chart has been sliding down for a while, but the last few candles show the price trying to slow down near support. Both the moving averages and indicators are still pointing to a weak trend, but the selling pressure looks lighter than before.
On the 1H view, the price is trying to hold above the recent low, showing small attempts from buyers. It’s not strong yet, but the market looks calmer than yesterday.
On the 4H view, the overall trend is still down, but the momentum is losing speed. If the support continues to hold, the market might try a small bounce. If not, it
ELIZAOS-1.13%
post-image
post-image
  • Reward
  • Comment
  • Repost
  • Share
DGRAM Market Update
DGRAM is moving in a calm range after a long dip, and the chart is starting to look more stable. Buyers stepped in a few times, lifting the price from the recent bottom. The candles are now sitting close to the moving averages, which usually means the market is getting ready for a direction.
In the short-term frame, DGRAM is slowly pushing upward from its weak zone. The small bumps in price show early signs of buyers returning, though the momentum is still soft.
In the mid-term view, the downtrend has slowed down a lot. If the price continues to hold above its recent suppor
DGRAM8.71%
post-image
post-image
  • Reward
  • Comment
  • Repost
  • Share
GAIB Market Update
GAIB showed a clean bounce after hitting the recent low, and momentum is slowly coming back. Buyers stepped in strongly, which pushed the price up before cooling off again. Right now, the market looks like it’s trying to build a new support zone.
On the short-term view, the candles are moving tightly around the moving averages, which usually means the market is preparing for its next move. If buying pressure holds, GAIB may try to retest the recent spike zone again.
The mid-term structure looks smoother. The trend is still recovering from the dip, but the indicators are slow
post-image
post-image
  • Reward
  • Comment
  • Repost
  • Share
  • Trending TopicsView More
  • Pin
Trade Crypto Anywhere Anytime
qrCode
Scan to download Gate App
Community
  • 简体中文
  • English
  • Tiếng Việt
  • 繁體中文
  • Español
  • Русский
  • Français (Afrique)
  • Português (Portugal)
  • Bahasa Indonesia
  • 日本語
  • بالعربية
  • Українська
  • Português (Brasil)