


#CryptoMarketsDipSlightly
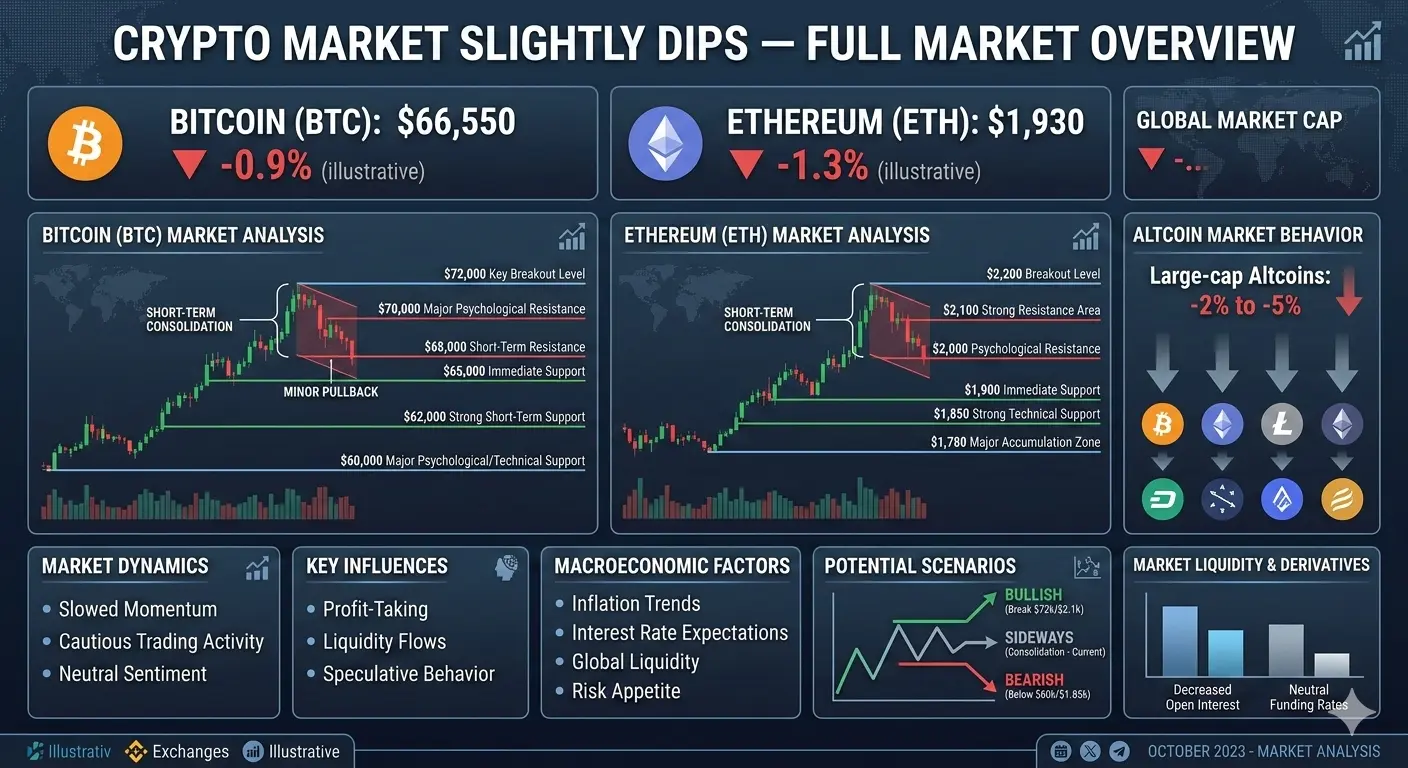
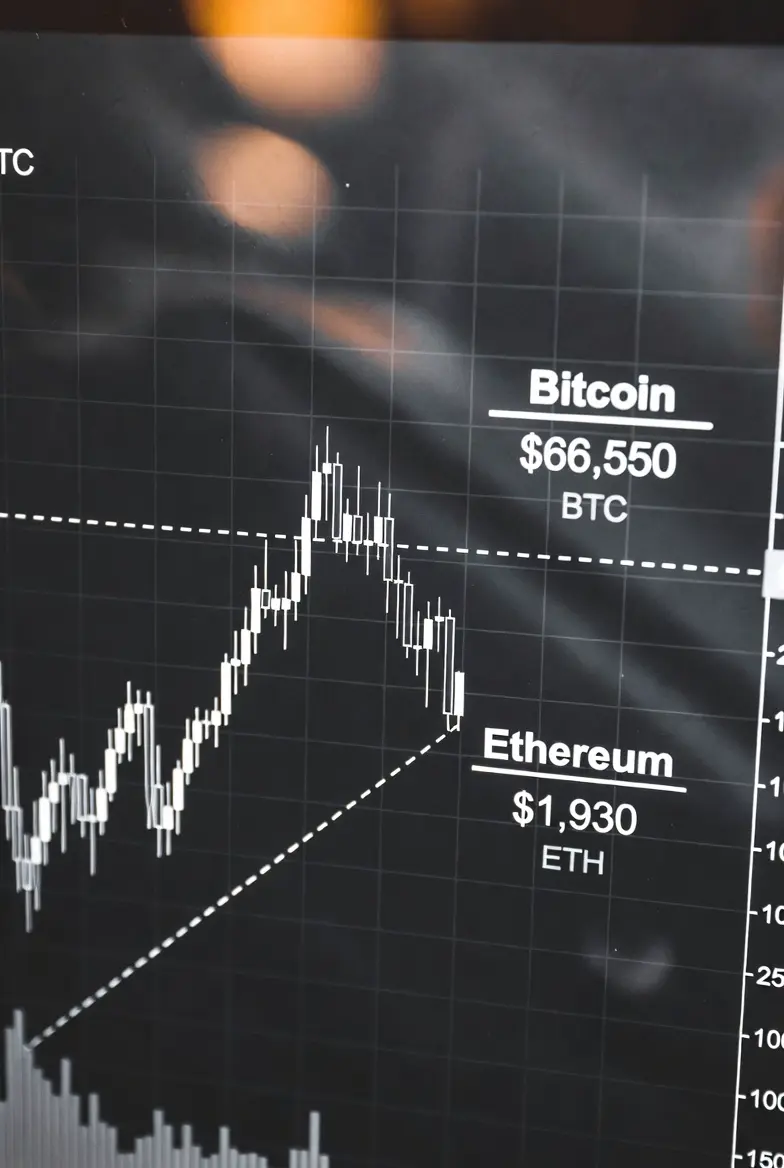
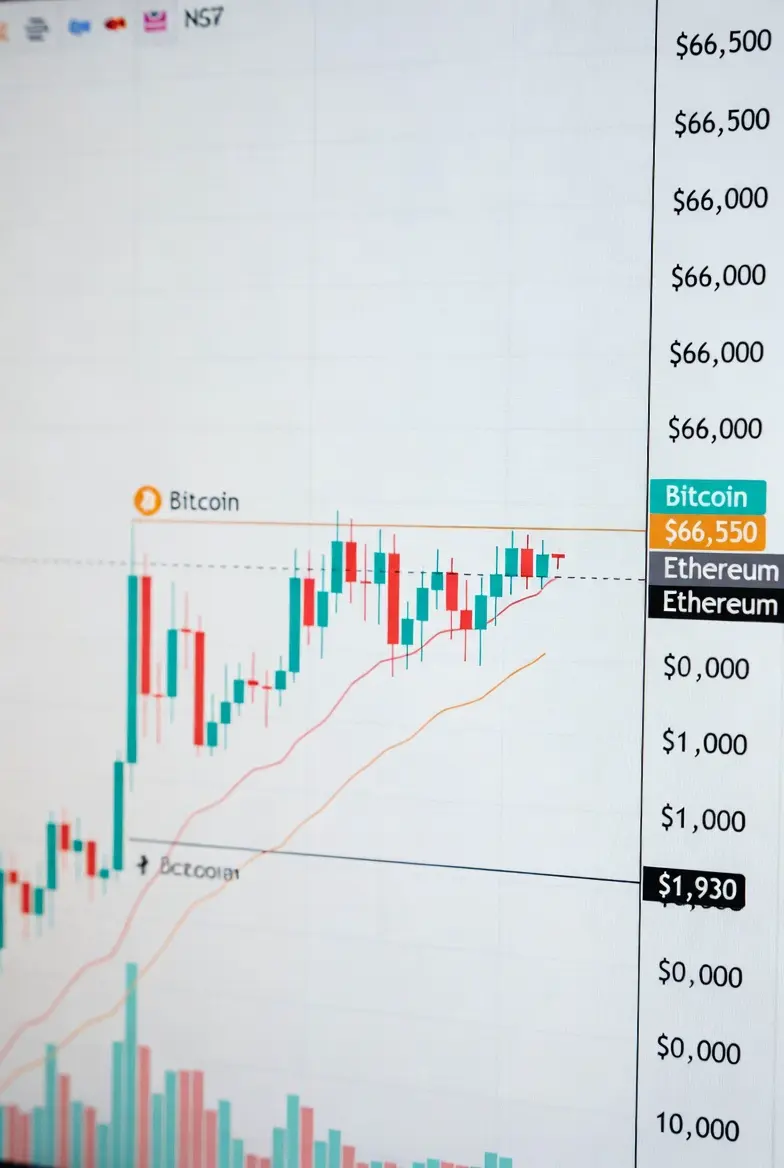
Cryptocurrency markets have been drawing investors' attention with a slight pullback in recent days. This decline appears to be influenced by macroeconomic factors such as geopolitical tensions, the sharp rise in oil prices, and disappointment in U.S. employment data. For instance, Bitcoin's price briefly dipped below $67,000 before showing signs of recovery, while the overall market cap experienced a loss of around $35 billion and held steady at the $2.36 trillion level. This situation parallels the sell-off wave in the broader technology sector; weakness in earnings reports from major tech companies has also pulled crypto assets lower.
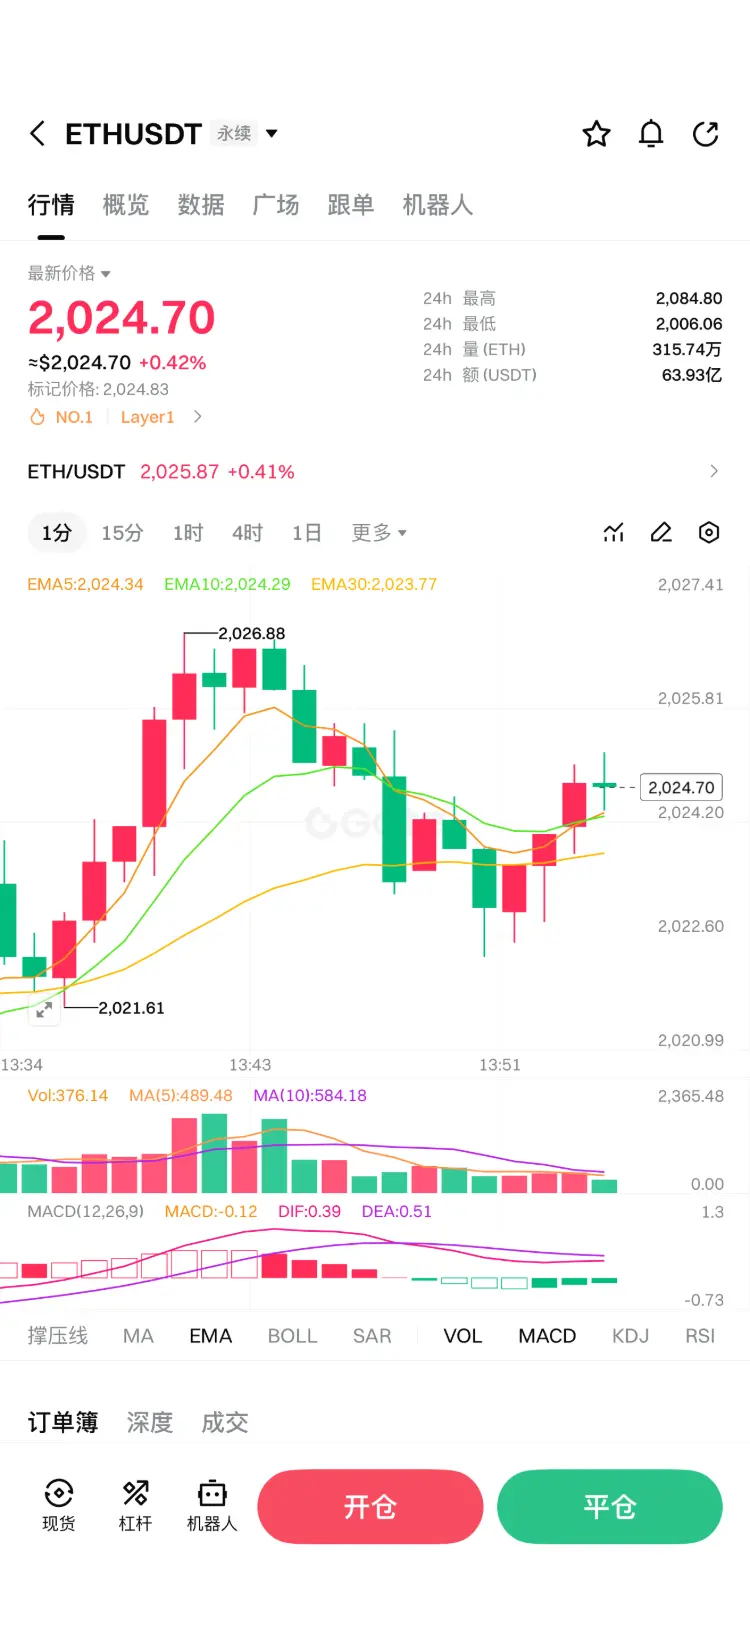
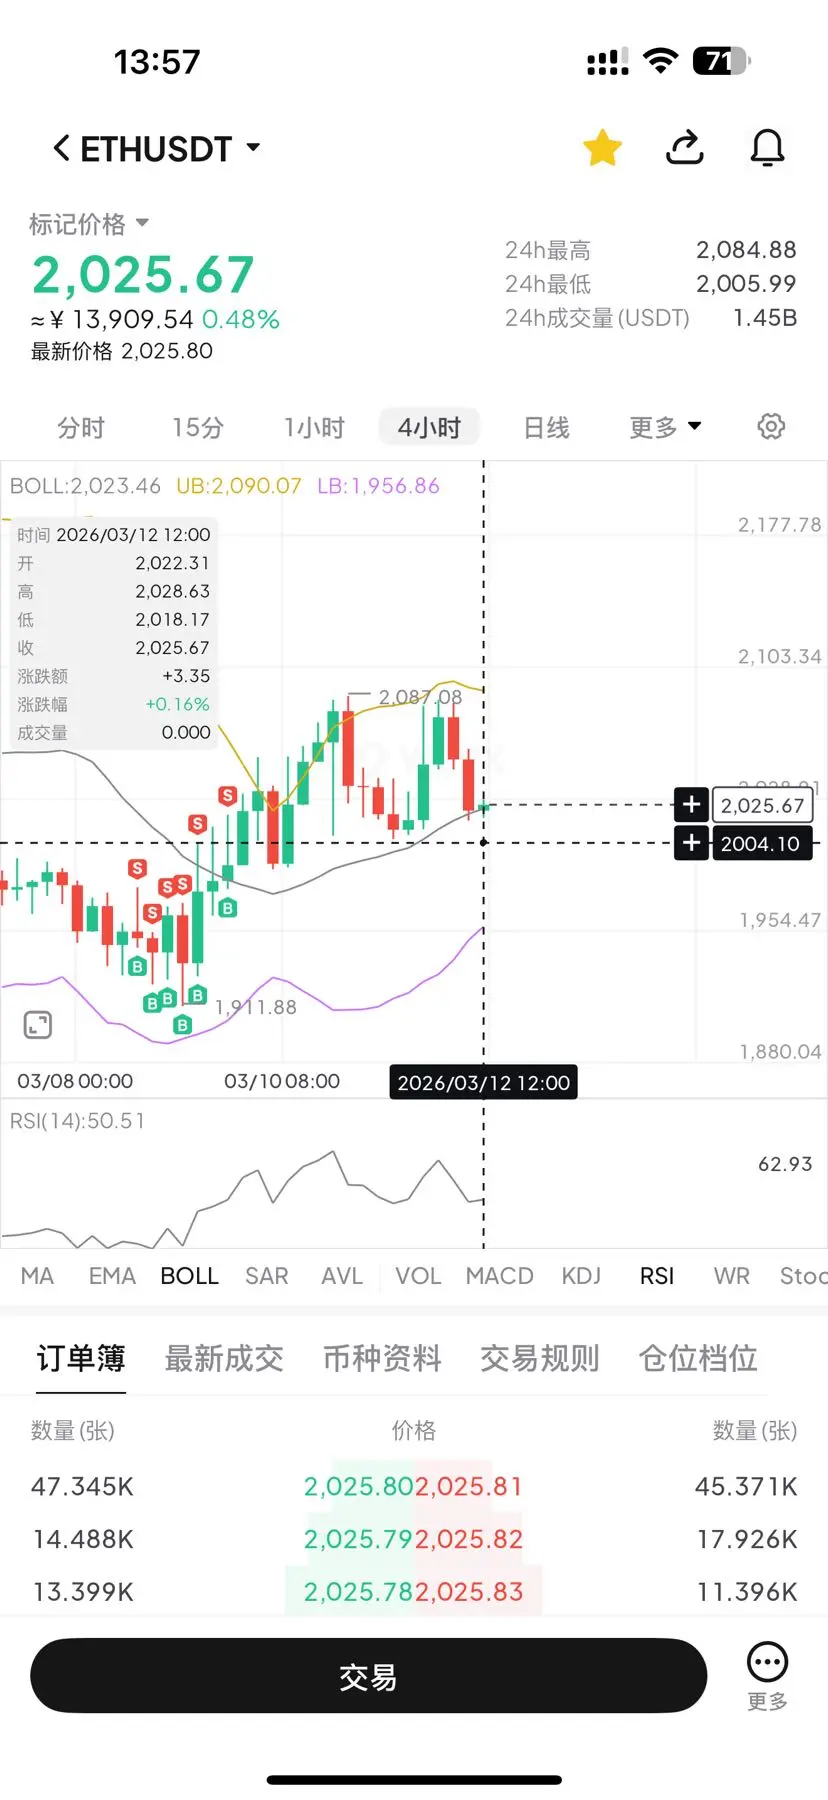
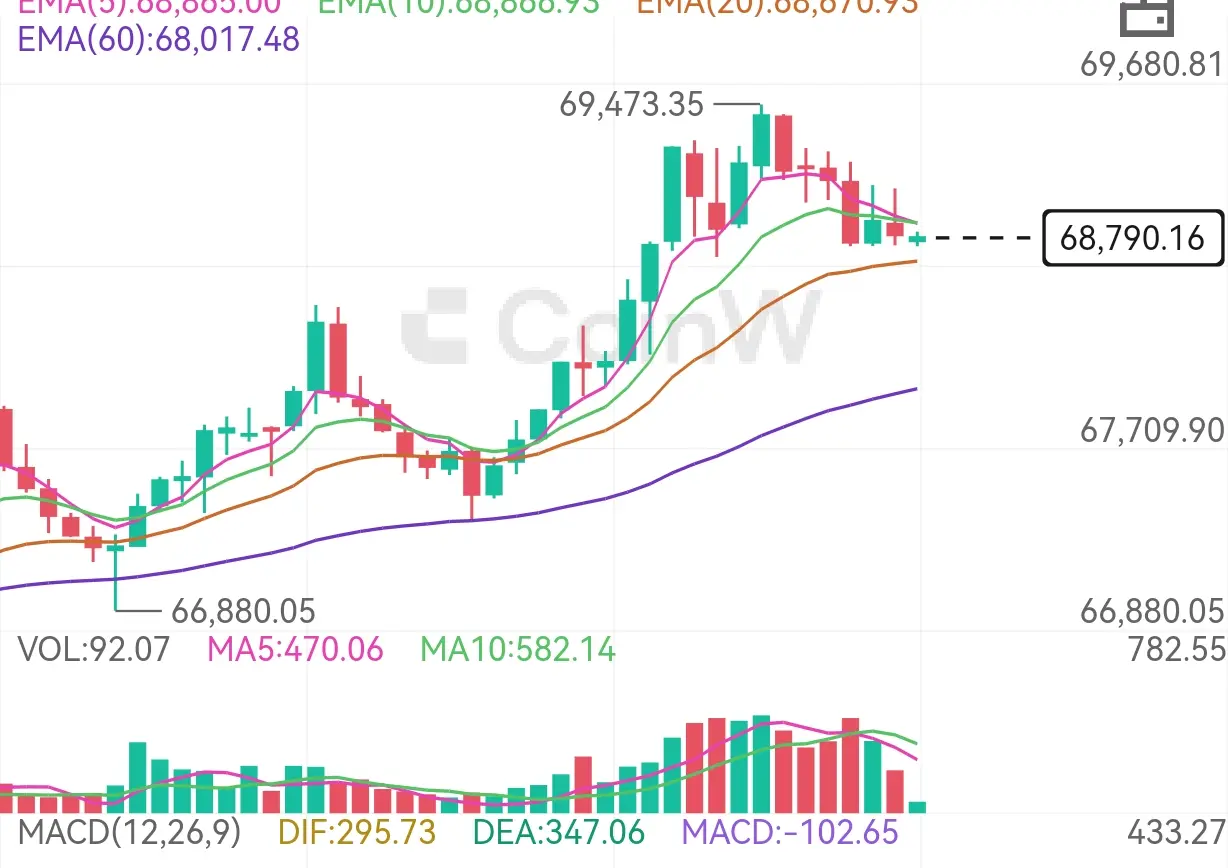
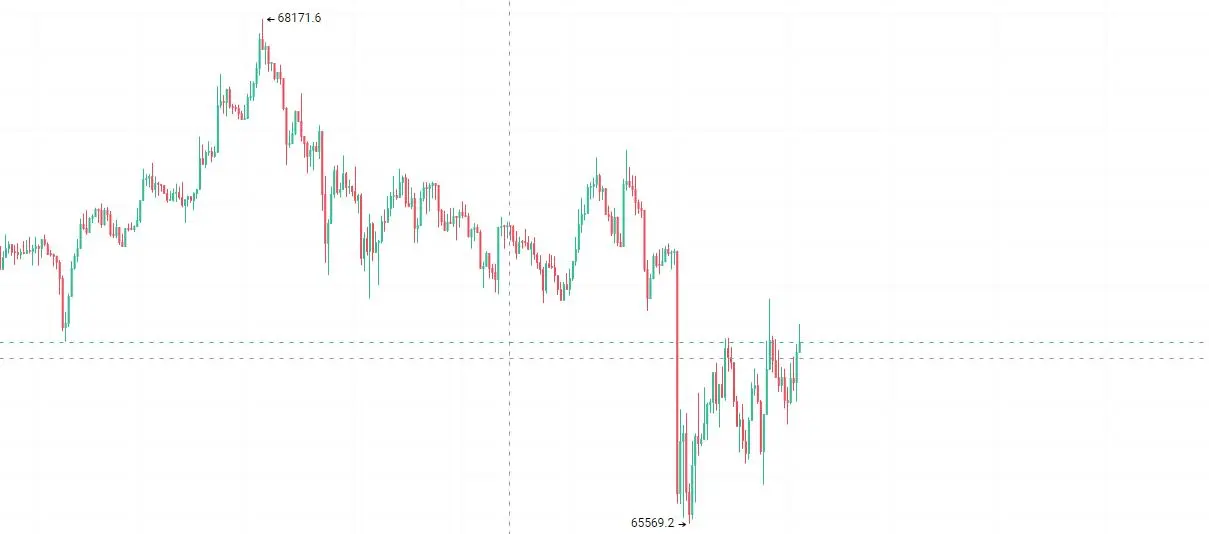
This mild slippage in the market has been particularly evident among leading crypto assets. Bitcoin fell about 1.3-1.4% in the last 24 hours to around $66,400 and recorded slight losses on a weekly basis. This pullback is linked to sales by large investors; despite retail buying, these moves could create more downward pressure. Ethereum declined around 2% to the $1,950 levels, though it is trying to hold at key resistance zones. Solana pulled back 2-3% to around $82, while XRP retreated about 1% to seek support in the $1.35 band. The common theme among these favorite assets is the preservation of long-term support levels despite short-term volatility; for example, Bitcoin dipping below $68,000 triggered the sharpest weekly rise in the dollar index.
Looking at the reasons behind the decline, the crisis in the Middle East significantly increased oil prices, accelerating the search for safe havens and impacting crypto markets. Additionally, the report of 92,000 job losses in the U.S. in February pushed Bitcoin below $69,000. Net outflows in spot Bitcoin ETFs also deepened this pullback. However, such corrections are a natural part of the market; historically, similar dips have foreshadowed new upward waves. Investors can watch key support levels for opportunities, as this mild retreat may be setting the stage for a more balanced recovery.
Cryptocurrency markets have been drawing investors' attention with a slight pullback in recent days. This decline appears to be influenced by macroeconomic factors such as geopolitical tensions, the sharp rise in oil prices, and disappointment in U.S. employment data. For instance, Bitcoin's price briefly dipped below $67,000 before showing signs of recovery, while the overall market cap experienced a loss of around $35 billion and held steady at the $2.36 trillion level. This situation parallels the sell-off wave in the broader technology sector; weakness in earnings reports from major tech companies has also pulled crypto assets lower.
This mild slippage in the market has been particularly evident among leading crypto assets. Bitcoin fell about 1.3-1.4% in the last 24 hours to around $66,400 and recorded slight losses on a weekly basis. This pullback is linked to sales by large investors; despite retail buying, these moves could create more downward pressure. Ethereum declined around 2% to the $1,950 levels, though it is trying to hold at key resistance zones. Solana pulled back 2-3% to around $82, while XRP retreated about 1% to seek support in the $1.35 band. The common theme among these favorite assets is the preservation of long-term support levels despite short-term volatility; for example, Bitcoin dipping below $68,000 triggered the sharpest weekly rise in the dollar index.
Looking at the reasons behind the decline, the crisis in the Middle East significantly increased oil prices, accelerating the search for safe havens and impacting crypto markets. Additionally, the report of 92,000 job losses in the U.S. in February pushed Bitcoin below $69,000. Net outflows in spot Bitcoin ETFs also deepened this pullback. However, such corrections are a natural part of the market; historically, similar dips have foreshadowed new upward waves. Investors can watch key support levels for opportunities, as this mild retreat may be setting the stage for a more balanced recovery.