Current Market Overview (March 13, 2026 early hours):
Bitcoin is trading in the 71,400 - 71,600 USD range. Latest aggregated data from sources like Yahoo Finance, CoinMarketCap, CoinGecko, CoinDesk, and Twelve Data:
Current Price: Approximately 71,300 - 71,580 USD (e.g., ~71,477 USD on Yahoo, ~71,347 USD on CoinGecko, ~71,230 USD on CMC – slight variations due to exchanges).
24-Hour Change: +2.5% to +3.3% (strong recovery momentum).
24-Hour High: ~71,948 - 72,023 USD (recent peak testing upper levels).
24-Hour Low: ~69,230 - 70,491 USD.
The market has reclaimed the key 70,000 USD psychological level with increased volume, supported by institutional flows (e.g., ETF inflows) and positive sentiment, despite ongoing geopolitical tensions (e.g., oil price concerns from Middle East developments).
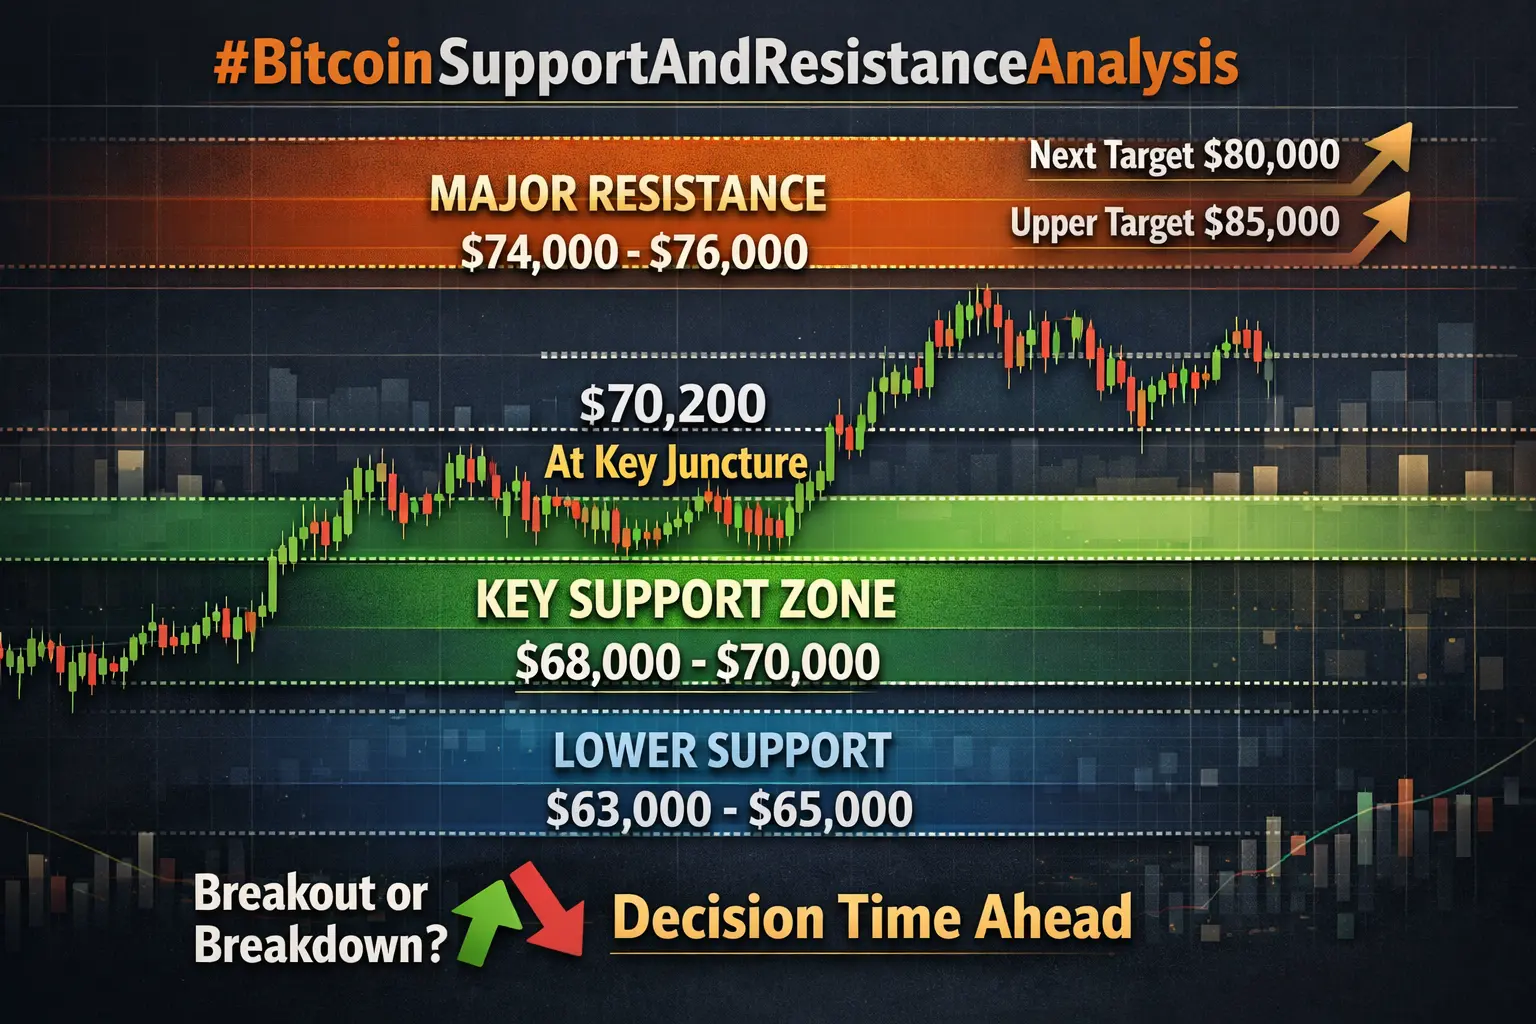
Key Levels (Based on Technical Analysis – Pivot Points, Fibonacci, EMA, and Historical Reaction Zones):
Current Price: ~71,400 USD (mid-range consolidation with bullish bias on shorter timeframes).
Support Levels (Downside Protection):
First Support: 70,500 - 70,900 USD (recent breakout flip zone + short-term moving average confluence; buyers remain active here – critical hold level).
Secondary Support: 69,200 - 69,500 USD (24-hour local low + liquidity pool; strong reaction seen in recent volatility).
Medium-Term Strong Support: 67,000 - 68,000 USD (early March consolidation area + EMA proximity; major defense zone).
Critical Lower Band: 65,000 - 66,000 USD (deeper correction target; near 200-day EMA – break could accelerate selling).
Resistance Levels (Upside Targets):
First Resistance: 72,000 - 72,000 USD (24-hour high + psychological barrier; currently under test – volume breakout needed for continuation).
Critical Upper Resistance: 73,000 - 73,500 USD (Fibonacci extension + prior relative highs; heavy supply expected – key breakout level).
Extended Long-Term Resistance: 74,000 - 75,000 USD (potential March target; high rejection risk, but thin supply "air pocket" noted above 72K in some analyses could lead to quick moves toward 80K+ if cleared).
Technical and Fundamental Supporting Factors:
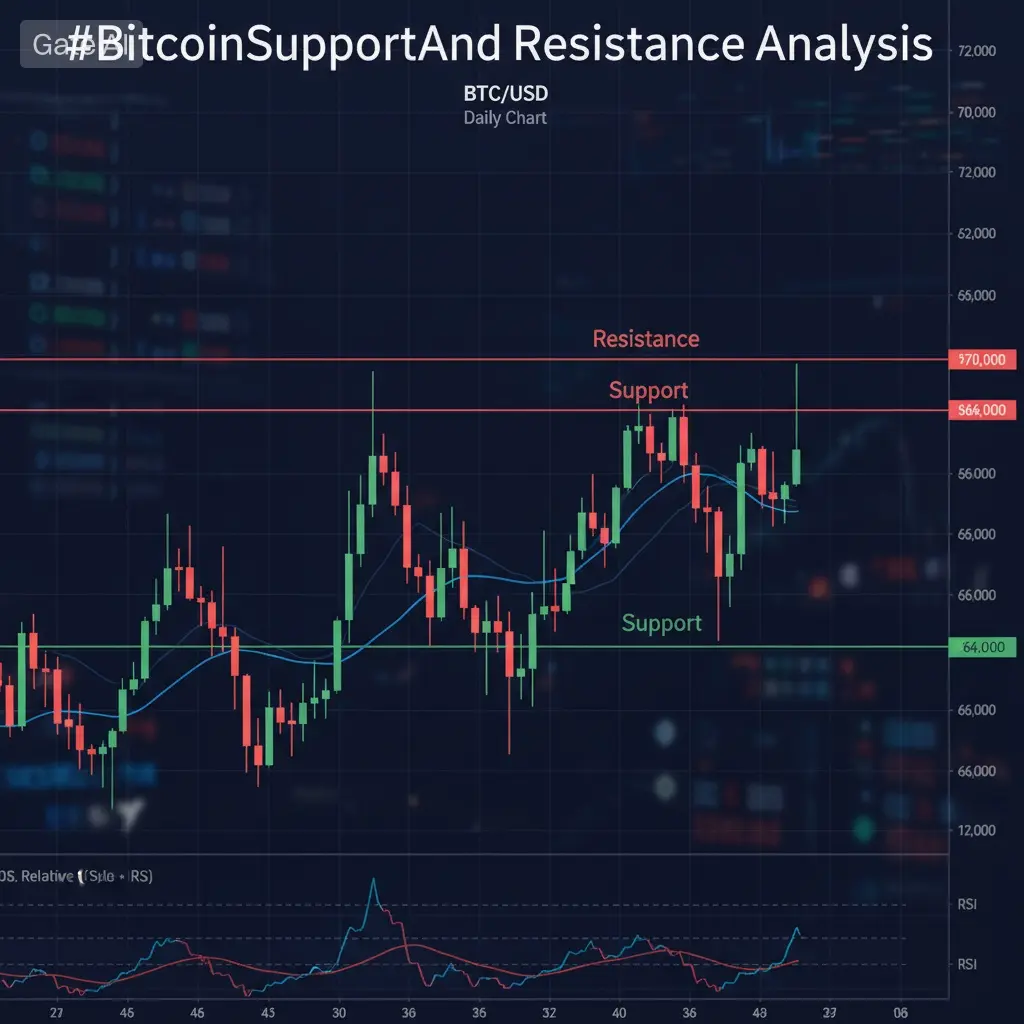
Short-term charts (15-min/4-hour) show bullish trend with MA alignments (e.g., shorter MAs above longer ones).
RSI nearing overbought territory (short-term pullback risk possible).
Volume surge visible; institutional/whale accumulation (e.g., spot buys outweighing some futures position reductions) supports upside.
Market sentiment balanced-positive; Fear & Greed Index in neutral-greedy zone.
Broader context: Thin order book supply above 72K in some data suggests limited resistance to 80K if momentum sustains, but macro risks (oil/geopolitics) remain.
Trader Notes & Risk Reminder:
Hold above 70,900-71,000 USD supports short-term bullish structure; break below could trigger pullback to 69K.
Daily close above 72,000 USD with volume could accelerate rally toward 73K-75K.
Stay cautious with sudden news flows (geopolitics, regulation, ETF updates); always use stop-losses.
This analysis is based on real-time aggregated data, technical indicators, and market sources – not investment advice. Do your own research.
What do you think – will BTC break and hold 72K this week, or pull back to test 70K? Share your views! 📈📉
#BitcoinSupportAndResistanceAnalysis
Bitcoin is trading in the 71,400 - 71,600 USD range. Latest aggregated data from sources like Yahoo Finance, CoinMarketCap, CoinGecko, CoinDesk, and Twelve Data:
Current Price: Approximately 71,300 - 71,580 USD (e.g., ~71,477 USD on Yahoo, ~71,347 USD on CoinGecko, ~71,230 USD on CMC – slight variations due to exchanges).
24-Hour Change: +2.5% to +3.3% (strong recovery momentum).
24-Hour High: ~71,948 - 72,023 USD (recent peak testing upper levels).
24-Hour Low: ~69,230 - 70,491 USD.
The market has reclaimed the key 70,000 USD psychological level with increased volume, supported by institutional flows (e.g., ETF inflows) and positive sentiment, despite ongoing geopolitical tensions (e.g., oil price concerns from Middle East developments).
Key Levels (Based on Technical Analysis – Pivot Points, Fibonacci, EMA, and Historical Reaction Zones):
Current Price: ~71,400 USD (mid-range consolidation with bullish bias on shorter timeframes).
Support Levels (Downside Protection):
First Support: 70,500 - 70,900 USD (recent breakout flip zone + short-term moving average confluence; buyers remain active here – critical hold level).
Secondary Support: 69,200 - 69,500 USD (24-hour local low + liquidity pool; strong reaction seen in recent volatility).
Medium-Term Strong Support: 67,000 - 68,000 USD (early March consolidation area + EMA proximity; major defense zone).
Critical Lower Band: 65,000 - 66,000 USD (deeper correction target; near 200-day EMA – break could accelerate selling).
Resistance Levels (Upside Targets):
First Resistance: 72,000 - 72,000 USD (24-hour high + psychological barrier; currently under test – volume breakout needed for continuation).
Critical Upper Resistance: 73,000 - 73,500 USD (Fibonacci extension + prior relative highs; heavy supply expected – key breakout level).
Extended Long-Term Resistance: 74,000 - 75,000 USD (potential March target; high rejection risk, but thin supply "air pocket" noted above 72K in some analyses could lead to quick moves toward 80K+ if cleared).
Technical and Fundamental Supporting Factors:
Short-term charts (15-min/4-hour) show bullish trend with MA alignments (e.g., shorter MAs above longer ones).
RSI nearing overbought territory (short-term pullback risk possible).
Volume surge visible; institutional/whale accumulation (e.g., spot buys outweighing some futures position reductions) supports upside.
Market sentiment balanced-positive; Fear & Greed Index in neutral-greedy zone.
Broader context: Thin order book supply above 72K in some data suggests limited resistance to 80K if momentum sustains, but macro risks (oil/geopolitics) remain.
Trader Notes & Risk Reminder:
Hold above 70,900-71,000 USD supports short-term bullish structure; break below could trigger pullback to 69K.
Daily close above 72,000 USD with volume could accelerate rally toward 73K-75K.
Stay cautious with sudden news flows (geopolitics, regulation, ETF updates); always use stop-losses.
This analysis is based on real-time aggregated data, technical indicators, and market sources – not investment advice. Do your own research.
What do you think – will BTC break and hold 72K this week, or pull back to test 70K? Share your views! 📈📉
#BitcoinSupportAndResistanceAnalysis