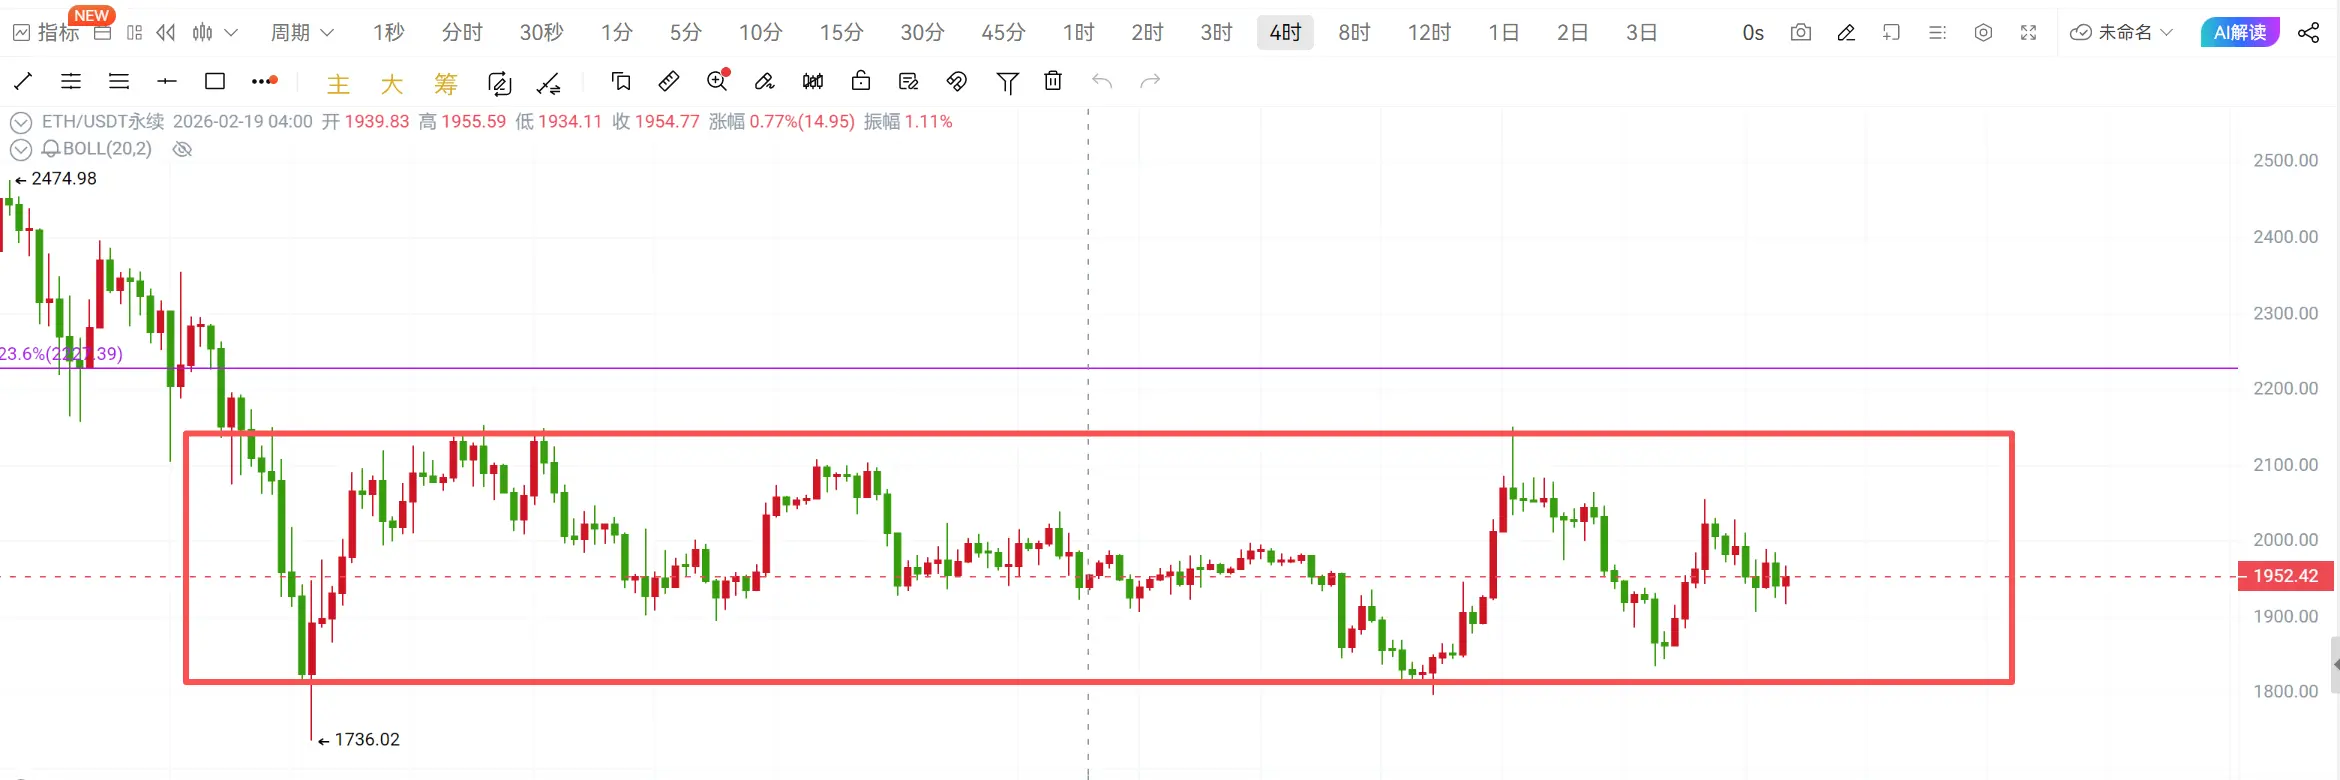
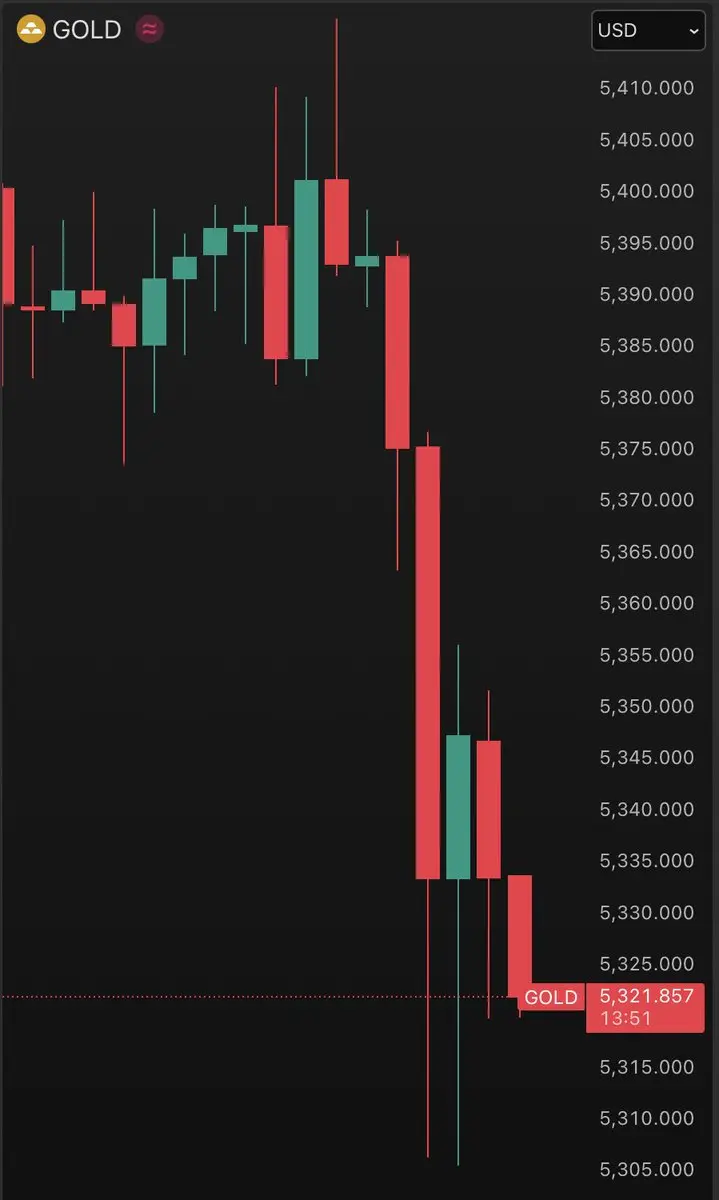
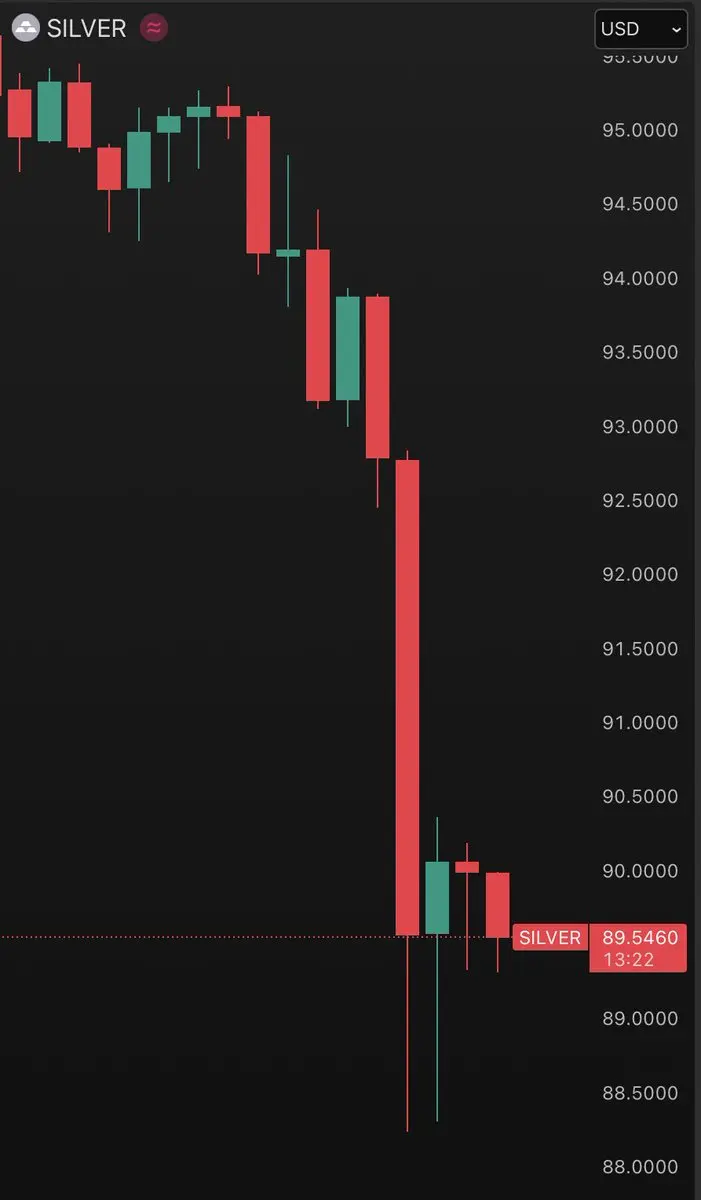


Weekly chart shows Bitcoin and Ethereum both closing with alternating bullish and bearish candles, indicating a typical consolidation phase. The trading range is gradually narrowing. Previously, the box structure was between 71,000 and 63,000. Currently, it is between 68,000 and 65,000, with resistance at 68,000-70,500 and support at 65,000-63,000. Ethereum's daily chart trend is synchronized with Bitcoin, with the previous box range between 1,800 and 2,150. Currently, it is between 2,000 and 1,900, with resistance at 2,050-2,150 and support at 1,920-1,800.
On the 4-hour chart, after the oversold correction, Bitcoin and Ethereum's trading ranges remain valid. Bitcoin is between 71,500 and 62,500, Ethereum between 2,150 and 1,800. The market is still in consolidation, and the major trend has not yet emerged. It is recommended to consider buying on pullbacks!
Trading ideas:
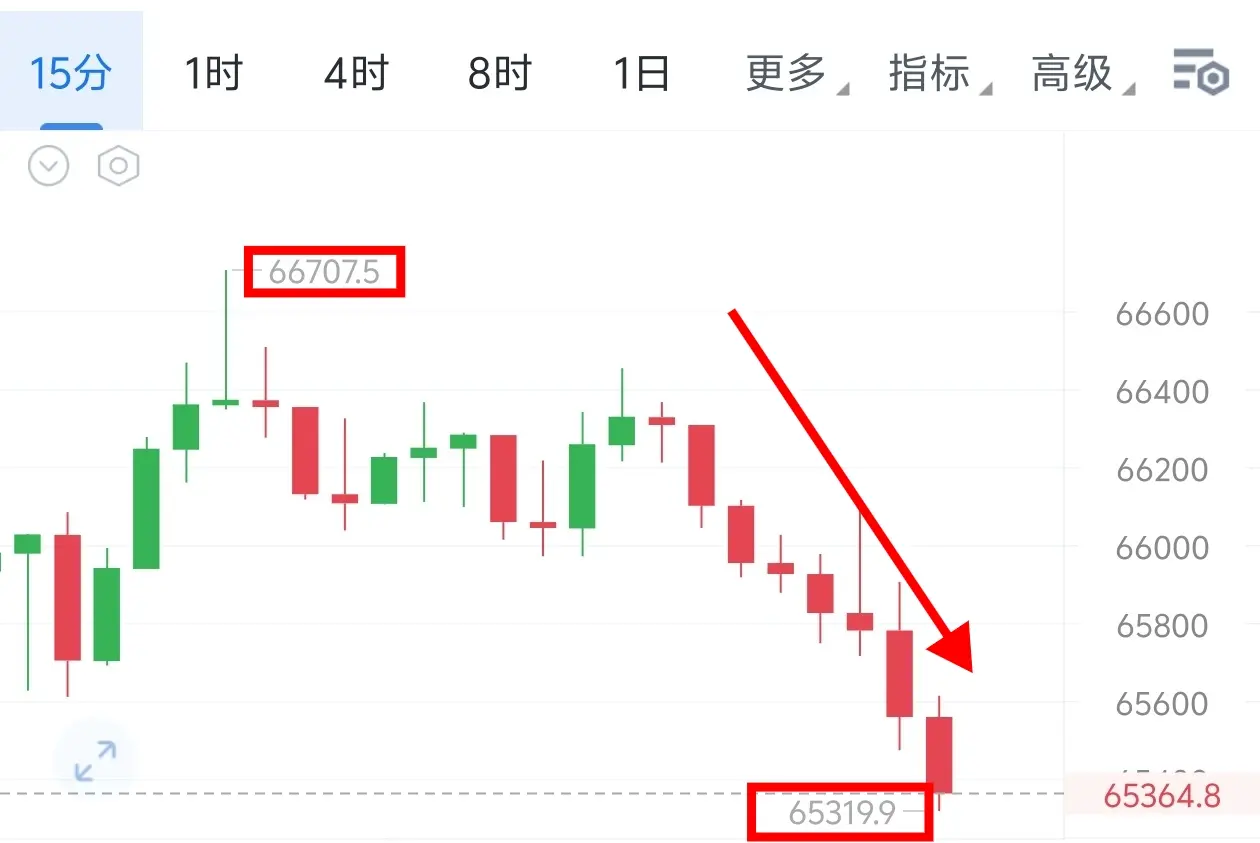
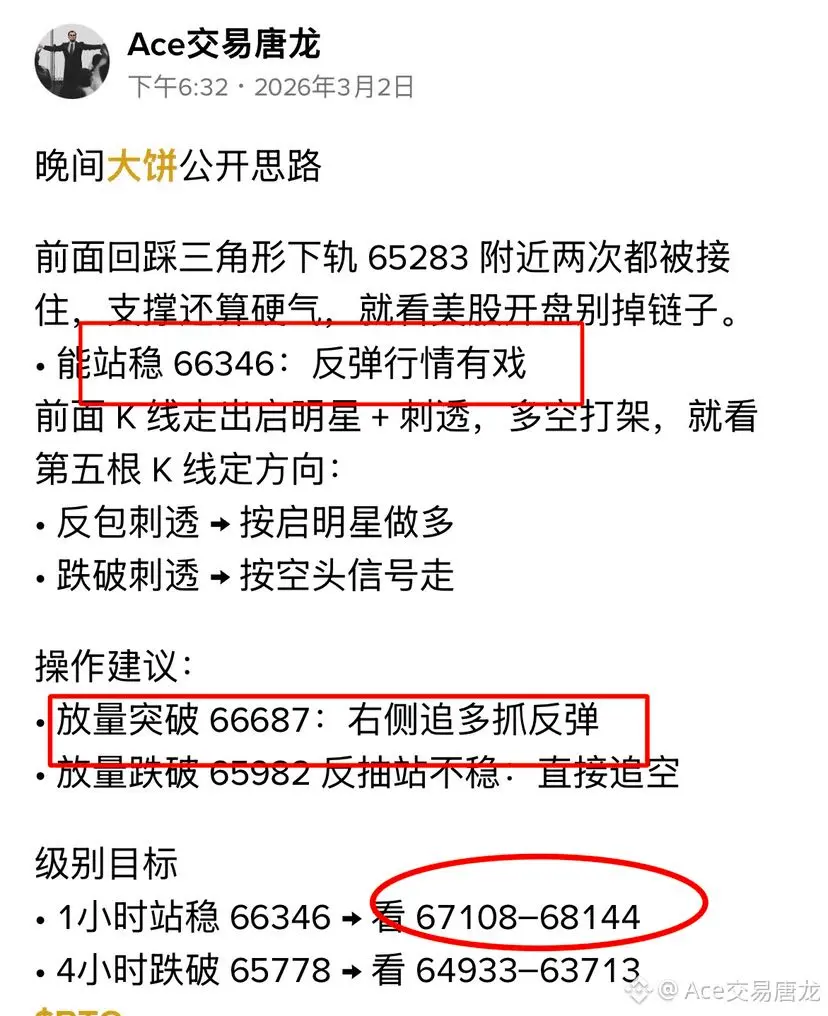
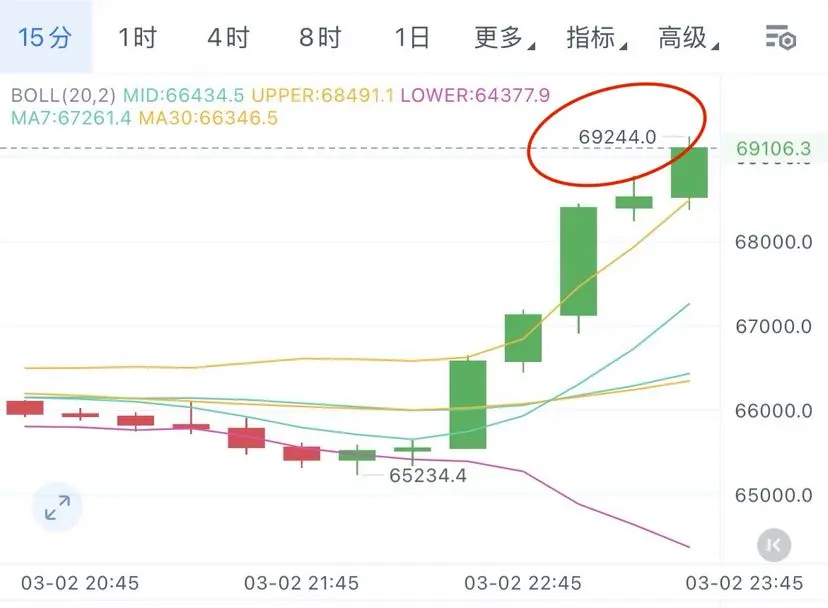
Buy Bitcoin at 65,300-65,800, target 67,000-68,000, stop below 64,500;
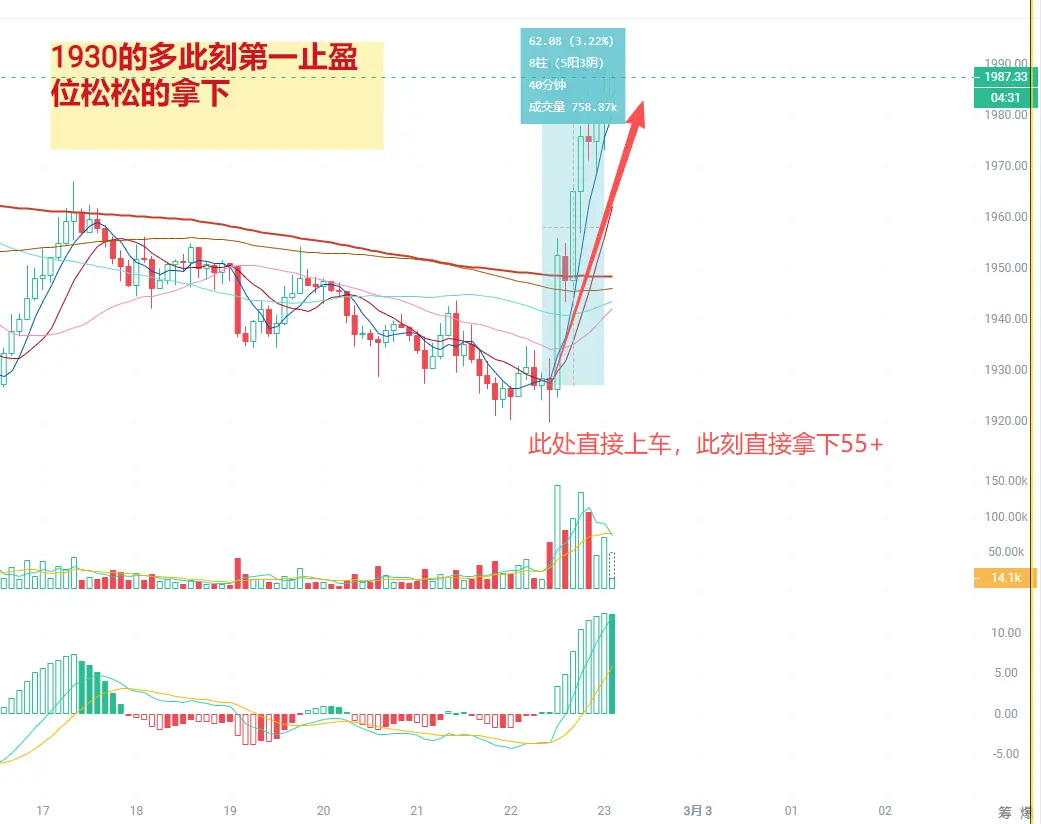
Buy Ethereum at 1,910-1,930, target 1,980-2,050, stop below 1,880;
This strategy is time-sensitive; specific guidance will be provided privately!#贵金原油价格飙升 #伊朗局势升级 #深度创作营
On the 4-hour chart, after the oversold correction, Bitcoin and Ethereum's trading ranges remain valid. Bitcoin is between 71,500 and 62,500, Ethereum between 2,150 and 1,800. The market is still in consolidation, and the major trend has not yet emerged. It is recommended to consider buying on pullbacks!
Trading ideas:
Buy Bitcoin at 65,300-65,800, target 67,000-68,000, stop below 64,500;
Buy Ethereum at 1,910-1,930, target 1,980-2,050, stop below 1,880;
This strategy is time-sensitive; specific guidance will be provided privately!#贵金原油价格飙升 #伊朗局势升级 #深度创作营