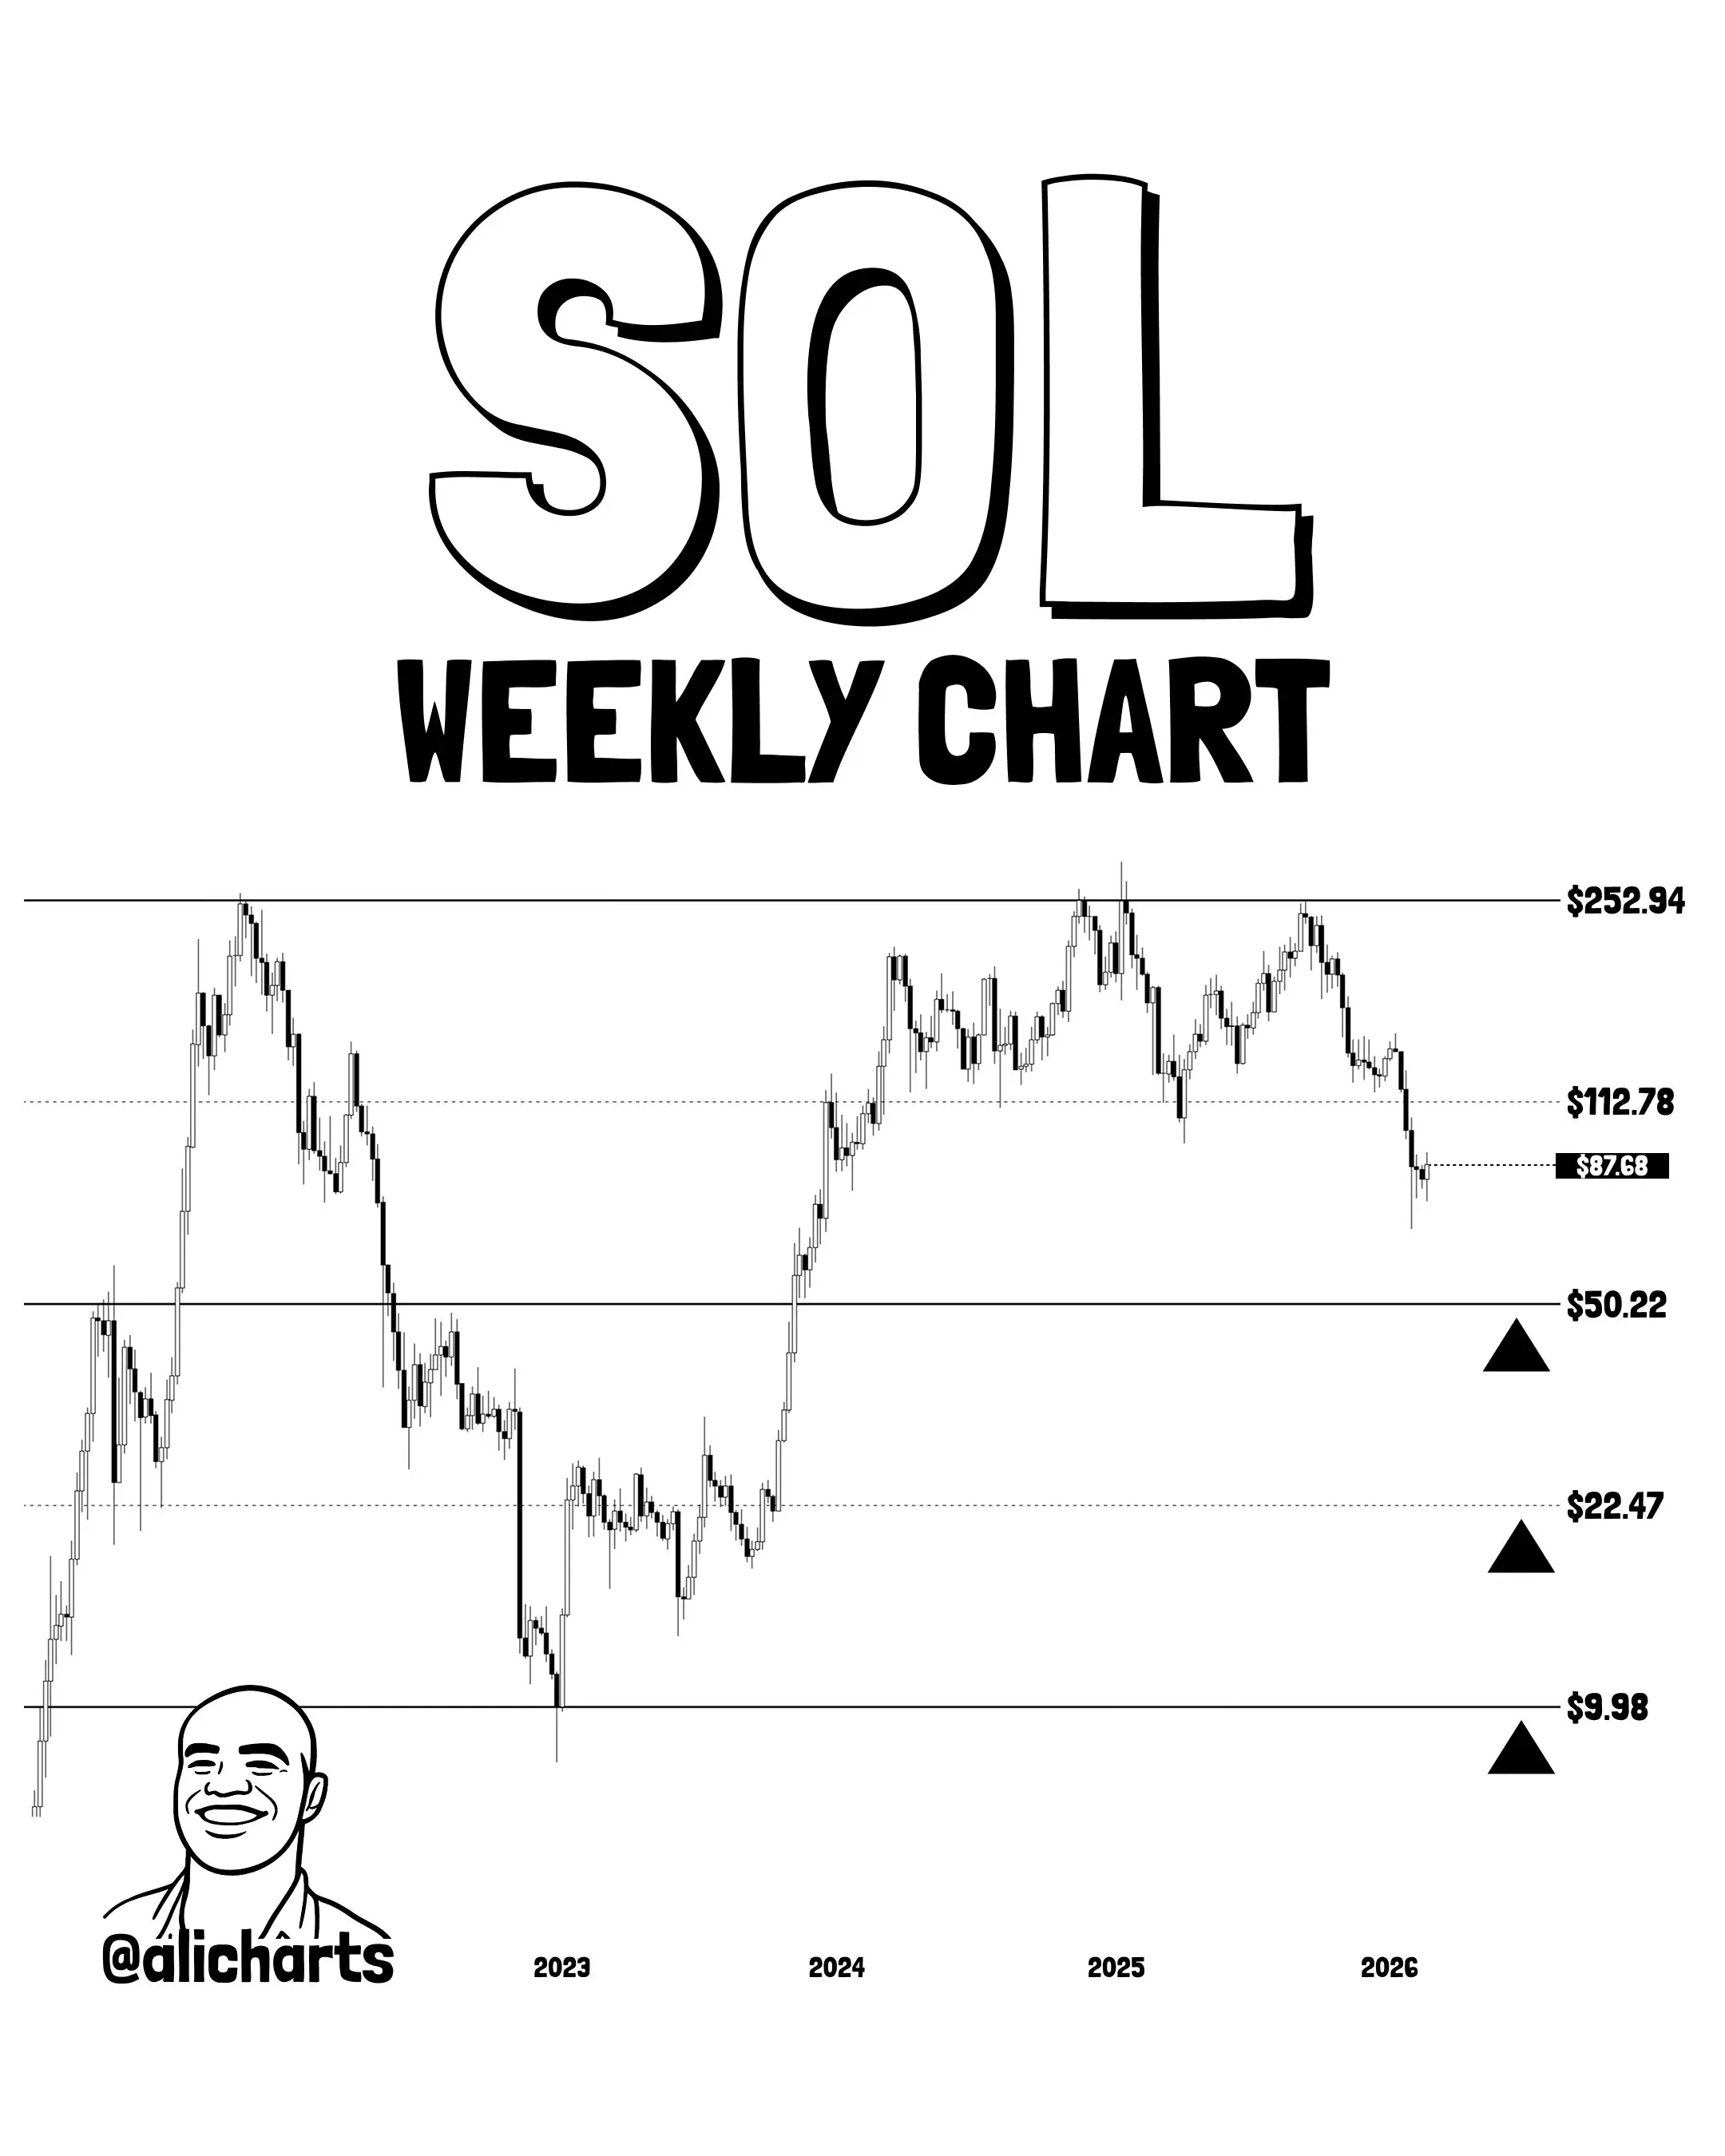
February 28 News, regarding Solana’s future trend, analyst Ali Martinez based his analysis on the weekly chart structure, suggesting that SOL may be operating within a long-term parallel channel. He identified three potential support zones at $50.22, $22.47, and $9.98.
A parallel channel is a classic technical analysis pattern, indicating that the price fluctuates between two parallel trend lines. If these lines are extended horizontally, it suggests the asset is in a sideways consolidation phase. From the weekly chart, Solana has repeatedly touched the upper boundary of the channel in recent years and then pulled back, showing strong selling pressure in that area. During 2025, SOL tested the upper boundary multiple times before turning down, indicating that the upper trend line acts as a significant resistance.
In the recent overall weakening of the crypto market, Solana has retreated from its highs and remains in the upper half of the channel. If bearish momentum continues, the price could seek lower support levels. Ali Martinez pointed out that $50.22 corresponds to about 50% of the channel’s downward range, $22.47 is near the 75% level, and $9.98 is close to the lower boundary of the channel.
(Source: X)
It is worth noting that during the last bear market, SOL stabilized near the bottom of the channel and rebounded, giving this position some historical reference value. However, whether this cycle will repeat a similar pattern depends on market liquidity, risk appetite, and overall sector sentiment.
For investors concerned with questions like “Solana price forecast 2026” or “Where is SOL’s key support level,” the above zones may become key points for medium- to long-term observation. But until the trend becomes clearer, whether the weekly chart structure can continue to maintain the channel pattern remains to be seen.
Disclaimer: The information on this page may come from third parties and does not represent the views or opinions of Gate. The content displayed on this page is for reference only and does not constitute any financial, investment, or legal advice. Gate does not guarantee the accuracy or completeness of the information and shall not be liable for any losses arising from the use of this information. Virtual asset investments carry high risks and are subject to significant price volatility. You may lose all of your invested principal. Please fully understand the relevant risks and make prudent decisions based on your own financial situation and risk tolerance. For details, please refer to
Disclaimer.
