
Key Takeaways
-
AVAX/BTC is flashing a rare fractal similar to its 2020 pre-bull run
-
AVAX remains capped beneath long-term descending resistance
-
A breakout could signal trend reversal and renewed relative strength
-
Analysts are watching the September 2025 highs (~$36) as a potential upside target
The broader altcoins crypto market has faced strong selling pressure over the past 30 days, with Ethereum (ETH) sliding more than 33%, keeping pressure firmly on major altcoins.
Among them, Avalanche (AVAX) has also been weak — dropping over 34% during the same period. But beneath the surface, this pullback has pushed AVAX/BTC into a structure that’s starting to look eerily familiar.
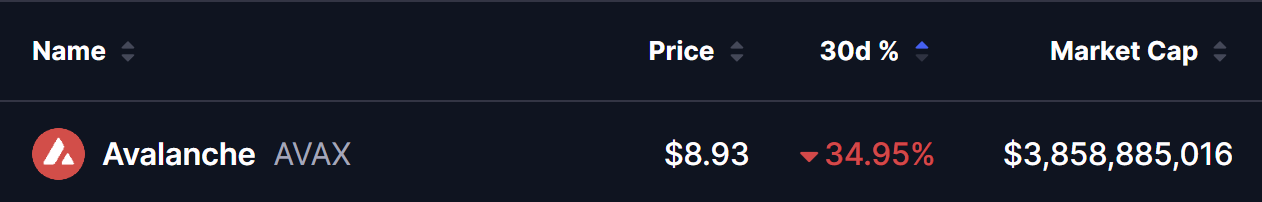
Source: Coinmarketcap
According to market watchers, AVAX is now mirroring its **2020 pre-bullish rally **fractal — a setup that previously marked the beginning of a powerful relative-strength move against Bitcoin.
AVAX Mirrors Its 2020 Pre-Bullish Rally Setup
Crypto analyst Kaleo recently pointed out that the current AVAX/BTC price action looks “incredibly similar” to what unfolded in late 2020, shortly after Avalanche’s mainnet launch.
Back then, AVAX experienced an early hype-driven spike followed by a sharp correction. Price then spent months grinding lower before finally forming higher-timeframe lows. Once structure flipped bullish, AVAX entered a new range — a move that later fueled massive gains during the 2020–2021 altseason.
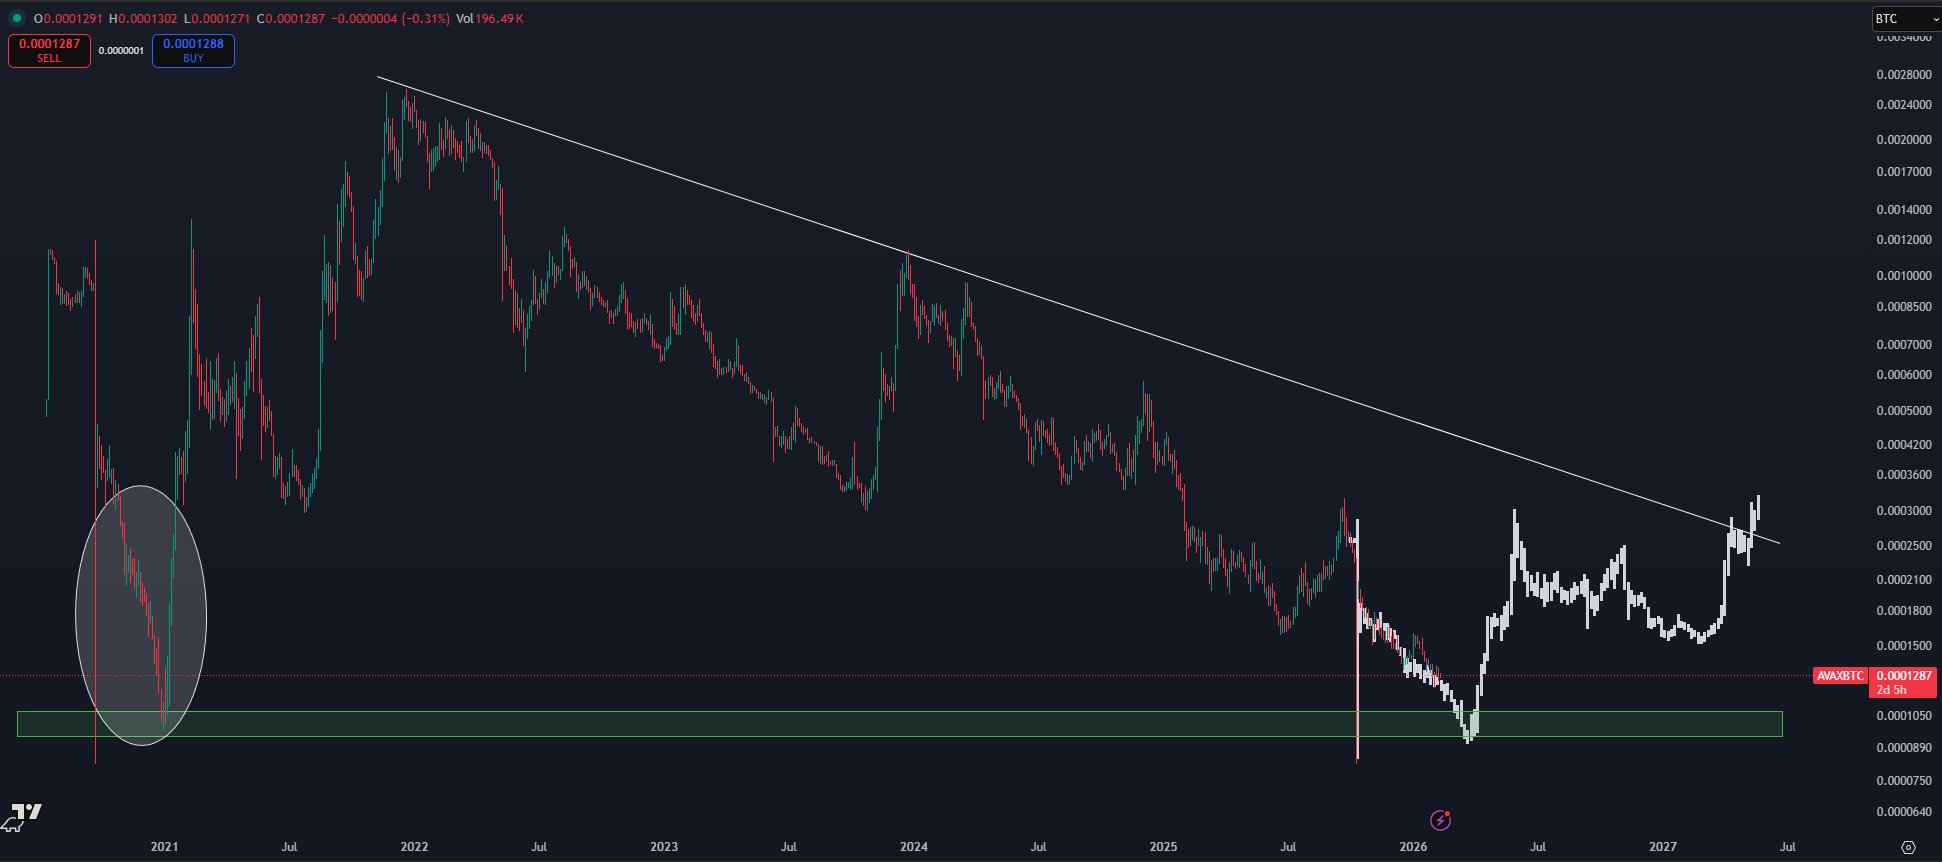
Avalanche (AVAX) Fractal Setup/Credits: @CryptoKaleo (X)
On today’s chart, we’re seeing a nearly identical structure developing.
AVAX/BTC has been trending beneath a long-term descending resistance line while slowly compressing into higher-timeframe demand. After weeks of downside pressure, price recently rebounded from a major green support zone — the same type of base that previously preceded AVAX’s breakout.
The visual similarity stands out: a prolonged downtrend, a capitulation move into macro support, followed by early signs of recovery — all while price remains capped beneath long-term resistance.
Kaleo’s thesis is that AVAX may still experience some chop or minor downside, but if this fractal continues to play out, the pair could establish a higher-timeframe low and begin forming a fresh accumulation range.
What’s Next for AVAX?
If this historical pattern repeats, the current rebound could mark the early stages of a new accumulation phase.
From here, bulls will want to see AVAX continue holding its higher-timeframe demand zone while printing higher lows. A breakout above the descending trendline would be the strongest confirmation that a trend reversal is underway.
Should that happen, AVAX could start outperforming Bitcoin again — similar to what played out during the previous cycle. Analysts are already eyeing a potential move back toward the September 2025 highs near $36, especially if Bitcoin stabilizes and broader altcoin sentiment improves.
Key Risk to Watch
Fractals don’t guarantee outcomes.
If AVAX/BTC fails to hold its current support and slips back below the demand zone, this bullish setup would be invalidated — likely leading to more sideways or downside action before any meaningful recovery attempt.
For now, however, price is reacting exactly where long-term buyers stepped in last time.
Disclaimer: The views and analysis presented in this article are for informational purposes only and reflect the author’s perspective, not financial advice. Technical patterns and indicators discussed are subject to market volatility and may or may not yield the anticipated results. Investors are advised to exercise caution, conduct independent research, and make decisions aligned with their individual risk tolerance.
About Author: Nilesh Hembade is the Founder and Lead Author of Coinsprobe, with over 5 years of experience in the cryptocurrency and blockchain industry. Since launching Coinsprobe in 2023, he has been providing daily, research-driven insights through in-depth market analysis, on-chain data, and technical research.
Disclaimer: The information on this page may come from third parties and does not represent the views or opinions of Gate. The content displayed on this page is for reference only and does not constitute any financial, investment, or legal advice. Gate does not guarantee the accuracy or completeness of the information and shall not be liable for any losses arising from the use of this information. Virtual asset investments carry high risks and are subject to significant price volatility. You may lose all of your invested principal. Please fully understand the relevant risks and make prudent decisions based on your own financial situation and risk tolerance. For details, please refer to
Disclaimer.
Related Articles
BTC 15-minute rise of 0.53%: Institutional derivatives adding positions drives a short-term rebound
Between 2026-04-20 01:30 and 2026-04-20 01:45 (UTC), the BTC spot price fluctuated within a narrow range of 74290.9 to 74709.7 USDT. Over the 15-minute period, the return was +0.53%, with a range of 0.56%. Overall market volatility increased, drawing attention, but the number of active on-chain addresses remained steady, with no sign of extreme capital movements.
The main driver behind this move is institutional capital inflows into mainstream futures platforms and adjustments to derivatives position structures, especially CME futures open interest (OI), which rose against the trend by 2.61%. Meanwhile, some institutions added to defensive hedges and positioned for short-term rebounds within the price consolidation range. In addition, short-term Put options trading on platforms such as Deribit was active: the main contracts were concentrated on near-term downside protection, indicating that derivatives capital has increased its allocation to defensive strategies and that the spot market has passively followed the upward move.
In addition, ETF funds recorded $1.87 billion in net inflows in Q1, easing the consecutive net outflow trend seen earlier before March and providing medium-term background support for spot prices. Although on-chain active addresses over 1 hour stayed in the 19500–19600 range without abnormal increases or decreases, structural behavior by institutions across the derivatives and ETF markets converged to push short-term price volatility higher. There were no signals of sell pressure from retail traders or major whales, and no large transfers or extreme liquidation events; overall momentum came from institutional-level maneuvering.
It is worth noting that the derivatives market Put/Call ratio remains on the high side. If the price cannot continue moving upward, short-term exit pressure could intensify at any time. With overall OI shrinking, the activity of leveraged funds in the market weakens. Going forward, it is important to focus on changes in derivatives positions, ETF fund flows, and the in-and-out movements of active capital on-chain in order to respond to the risk of sharp short-term volatility. For more market information, it is recommended to continuously track relevant data indicators and capital-level anomalies.
GateNews2h ago
BTC falls 0.44% in 15 minutes: ETF fund outflows and derivatives shorts add to the slide
From 21:45 to 22:00 (UTC) on April 19, 2026, the BTC price dropped by 0.44% within 15 minutes. The candlestick range was 74,366.1 to 74,789.3 USDT, with an amplitude of 0.57%. Short-term volatility was concentrated. During this period, the trading volume for large orders rose significantly, market attention increased, and volatility intensified.
The main driving force behind this deviation was that U.S. spot Bitcoin ETFs saw a large net outflow of $291 million over two days from April 18 to April 19. This reflected institutional funds pulling away in the short term, which led to a marked increase in sell pressure in the spot market. At the same time, BTC perpetual contract
GateNews6h ago
BTC falls below 74000 USDT
Gate News bot message, Gate market data shows that BTC has fallen below 74000 USDT, with a current price of 73979.6 USDT.
CryptoRadar6h ago
BTC dips slightly by 0.53% in 15 minutes: whale transfers increase sell pressure and amplified liquidity widen the short-term drop
From 17:45 to 18:00 (UTC) on 2026-04-19, within 15 minutes BTC’s spot price fell -0.53%, with a price range of 74648.4 to 75212.8 USDT and a swing of 0.75%. During this period, market attention increased, volatility clearly accelerated, and the magnitude of the abnormal move exceeded typical levels for the same timeframe.
The main driver behind this abnormal move was that large-whale accounts concentrated transfers of BTC to a certain major exchange; the All Exchanges Whale Ratio (EMA14) rose to a near-ten-month high, and sell pressure increased significantly in a short time, becoming a direct cause of the spot price decline.
GateNews10h ago
BTC falls below 75,000 USDT
Gate News bot message, Gate quotes show that BTC has fallen below 75,000 USDT, with a current price of 74,985.2 USDT.
CryptoRadar10h ago
