XRP down 2.62% to 1.5767. The Federal Reserve maintains 3.75%, with the March rate cut probability dropping to 8.4%. The White House stablecoin meeting ended without consensus, and Bank of America warns that $6 trillion in deposits may flow into DeFi. ETF weekly outflows amount to $52.26 million. The key support at $1.50, breaking below tests $1.0.
Federal Reserve March rate cut probability plummets to 8.4%
The core negative news for XRP today comes from the rapid decline in expectations of a rate cut by the Federal Reserve. Last week, the Fed kept interest rates steady at 3.75%, and Chair Jerome Powell hinted at adjusting policy stance based on specific meeting conditions. Powell pointed out that inflation remains high and the labor market is strong, so the likelihood of a rate cut in the near term is low. Since Powell made these comments, US producer price index data shows inflation outlook remains resilient, and manufacturing has returned to expansion, supporting a more hawkish stance from the Fed.
According to CME FedWatch data, the probability of a March rate cut has fallen from 17.3% on January 27 to 8.4% on February 3. Meanwhile, influenced by Powell’s remarks and US economic data, the probability of a rate cut in June has decreased from 65.4% to 56.1%. This sharp shift in expectations has directly impacted risk assets. As a highly volatile crypto asset, XRP’s opportunity cost of holding in a high interest rate environment has significantly increased.
When markets expect the Fed to keep rates high longer, institutional investors will reallocate portfolios, reducing holdings in high-risk assets like XRP and increasing fixed income products such as US Treasuries. The chance of a rate cut in March dropping from 17.3% to 8.4% indicates the market now sees the likelihood of a hawkish Fed stance rising from 82.7% to 91.6%. This marginal change in expectations is enough to trigger capital outflows from XRP.
Optimistic US economic indicators and Fed comments continue to suppress expectations of a rate cut in the first half of 2026, dampening market sentiment. When economic data is strong, the Fed has no reason to cut rates, which is a structural negative for cryptocurrencies that rely on loose liquidity. Only when economic data weakens significantly or inflation drops sharply will rate cut expectations reignite. Until then, XRP today will remain under pressure from the hawkish Fed shadow.
White House stablecoin meeting fails to reach consensus, bill stalls
Another core negative for XRP today is the delay in the market structure bill. On February 2, the White House held a cryptocurrency meeting with representatives from banking and crypto sectors to discuss the draft text of the Senate Banking Committee’s stablecoin yield bill. However, there was no substantive progress toward consensus, indicating the committee’s review process will face challenges.
In January, Coinbase (COIN) withdrew support for the Banking Committee’s “Market Structure Bill” draft. CEO Brian Armstrong warned that the draft would kill the incentive mechanisms for stablecoins and allow banks to prohibit transactions with competitors. This public split reveals serious disagreements within the crypto industry over the bill’s content, making legislative prospects more bleak.
The issue hinges on whether banks will accept stablecoin yields that far exceed traditional bank deposit rates, risking large outflows of deposits from US banks. Banks rely on customer deposits as low-cost funding to lend at higher rates to retail and corporate borrowers. The difference between deposit rates and loan rates, known as net interest margin (NIM), is fundamental to bank profits and underscores the importance of retaining deposits.
Crucially, if depositors shift to DeFi, banks will be forced to rely on alternative financing channels, such as wholesale funding. Higher financing costs will erode NIM and bank profitability. Previously, Bank of America CEO Brian Moynihan warned that if legislation allows stablecoin yields, over $6 trillion in deposits could flow from traditional finance (TradFi) into DeFi. This $6 trillion warning is the core reason banks strongly oppose stablecoin yield proposals.
Core conflict in stablecoin yield debate
Bank stance: Ban stablecoin yields to protect $6 trillion deposits from outflow
Crypto stance: Allow market-driven yields, free competition to serve users
Regulatory dilemma: Balance financial stability and market innovation, a tough choice
Negotiation deadlock: No consensus at White House meeting on February 2, bill stalls
Given the prolonged SEC vs. Ripple lawsuit concluded in August, XRP remains highly sensitive to regulatory developments. The token’s price plummeted from a high of $2.4151 on January 6 to a low of $1.5021 on January 31, reacting to delays in voting by the Senate Agriculture and Banking Committees. XRP’s price movement highlights the importance of the banking committee draft, which could be a more significant piece of legislation for DeFi.
ETF weekly outflows of $52.26 million signal supply-demand imbalance turning bearish
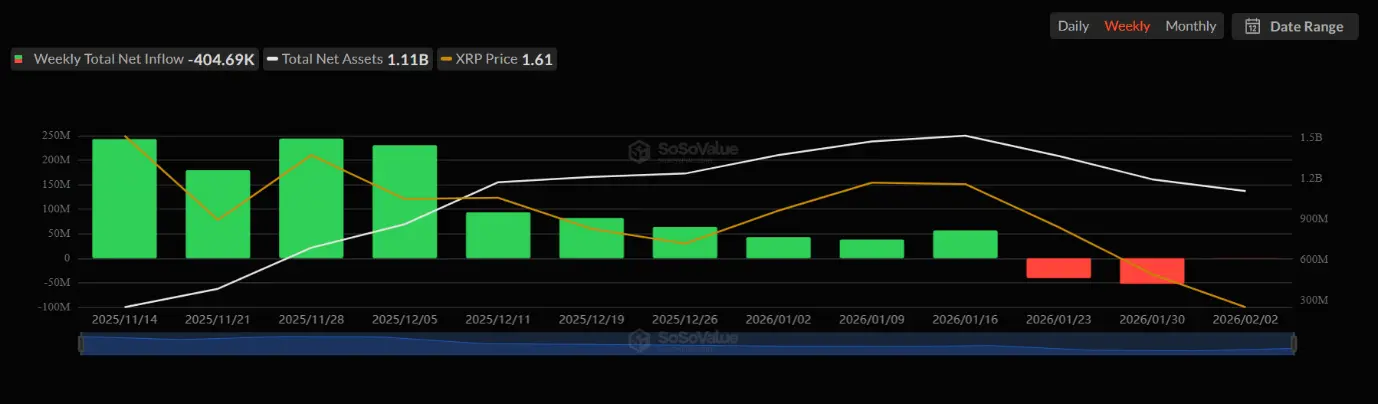
(Source: SoSoValue)
Importantly, the weakening expectations of a Fed rate cut in the first half of 2026, combined with the delayed crypto legislation, have cooled demand for XRP spot ETFs. On February 2, US XRP spot ETF market experienced net outflows of $410,000, following a previous week’s total net outflow of $52.26 million. Notably, the decline in spot ETF demand has tilted supply and demand toward the bearish side, supporting a short-term downside outlook.
Despite recent capital outflows, since trading began in November last year, the US XRP spot ETF market has accumulated net inflows of $1.18 billion. Strong capital inflows contrast sharply with the massive outflows from US Bitcoin spot ETFs, supporting a medium-term bullish trend. This accumulated net inflow remains a positive factor in XRP news today.
Technical analysis: $1.50 critical support determines trend
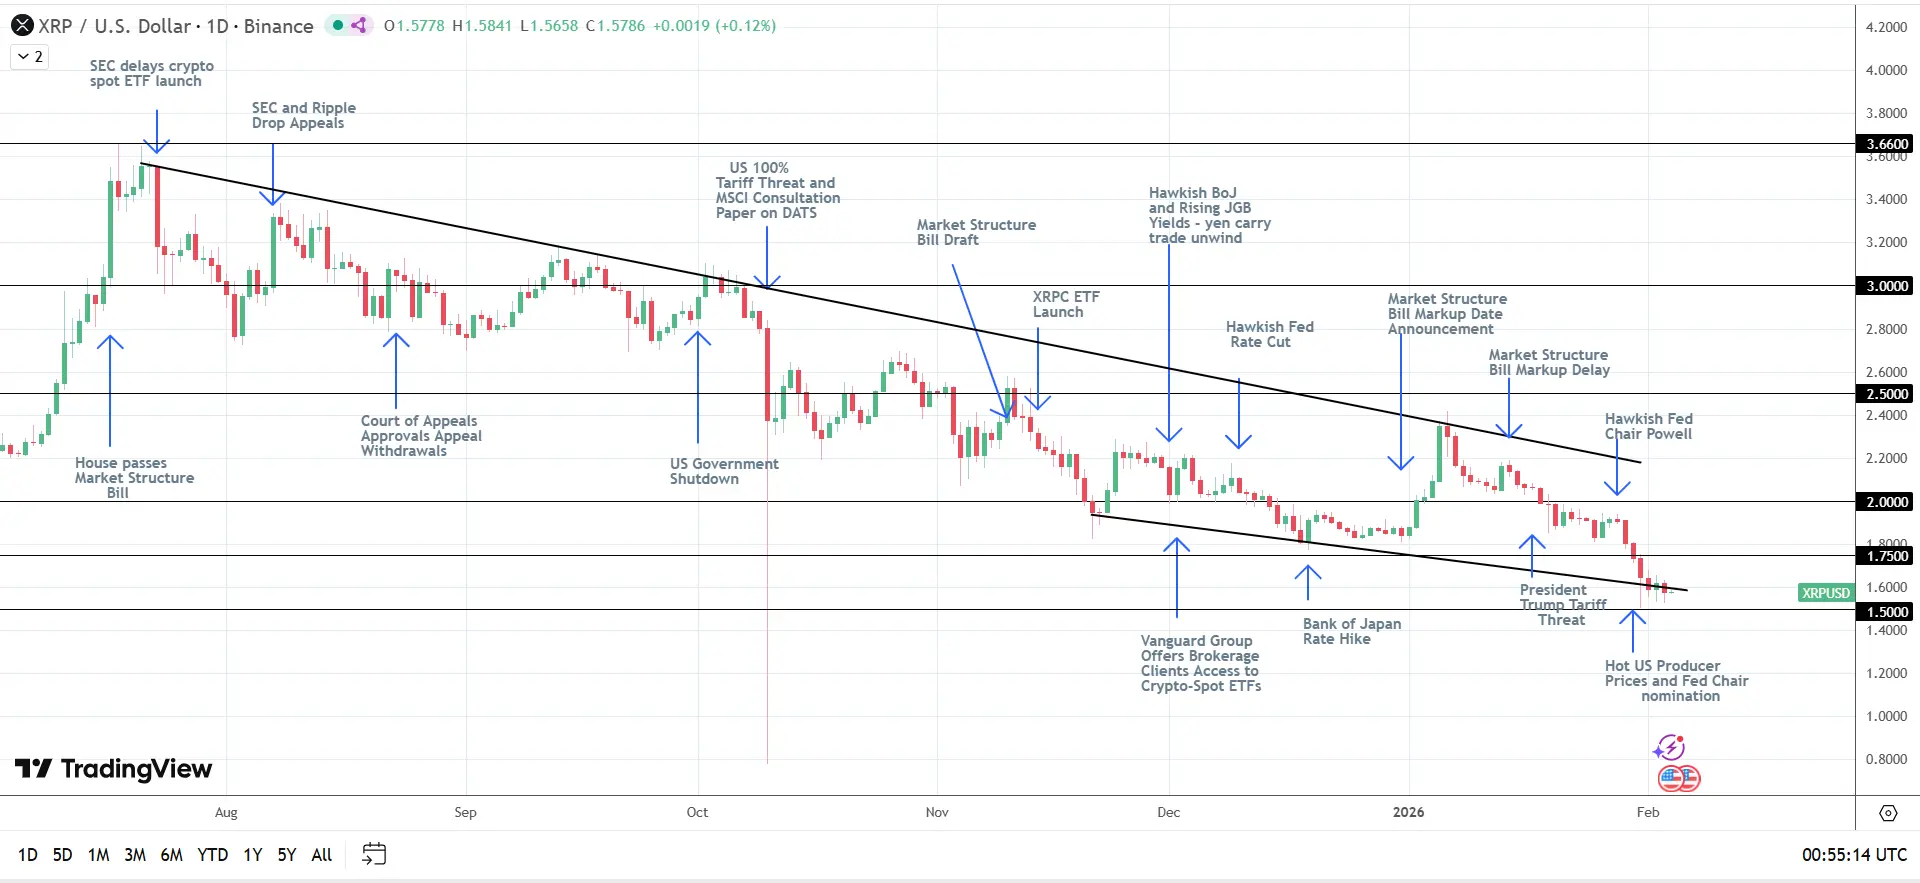
(Source: Trading View)
On February 3, XRP fell 2.62%, erasing the previous day’s 1.90% gain, closing at $1.5767. Ongoing selling pressure has driven XRP’s price well below its 50-day and 200-day moving averages, indicating a bearish bias.
XRP key technical levels
Support: $1.50, if broken, tests $1.0 psychological level, then breaks to test $0.7773 (October flash crash low)
50-day moving average resistance: $1.9279
200-day moving average resistance: $2.2370
Upper resistance levels: $1.75, $2.0, $2.5, $3.0
The January reversal signals a shift away from the bearish trend and negates short-term bullish expectations. However, XRP remains above $1.50, which is a critical support level. If it breaks below $1.50, it will confirm a short-term bearish outlook and validate the bearish structure.
Conversely, on the daily chart, if the price breaks above $1.75, bulls will target the 50-day moving average and $2.0. Continued breakout above the 50-day moving average and $2.0 would suggest a short-term trend reversal to bullish. After the trend reversal, the price could test $2.2. If it breaks above $2.2, the 200-day moving average will become the next target.
Related Articles
BTC rises 0.58% in 15 minutes: whale large-capital transfers and derivatives defensive positioning drive spot buying
2026-04-20 06:30 to 2026-04-20 06:45 (UTC), the BTC price recorded a +0.58% return rate. The candlestick range was 74347.7 to 74898.0 USDT, with an amplitude of 0.74%. During this period, market attention increased because large orders and on-chain capital flow showed abnormal fluctuations, resulting in a higher overall volatility.
The main driver behind this anomalous move is whale entities concentrating large withdrawals and transfers targeting exchanges. Over the past 24 hours, the total reached 3,824 BTC, directly reducing the exchange’s BTC liquidity and bringing increased buy pressure to the spot market. On-chain data shows that the value of large transfers per transaction exceeding 1 million US dollars rose significantly during this window. As exchange immediate liquidity contracted, it pushed the BTC price upward in the short term. In addition, the derivatives market’s positioning structure changed: total futures open interest (OI) fell, and some defensive options positions shifted toward spot buying, further strengthening upside momentum.
Second, overall market liquidity remains in a fragile range. Order book data shows that large market buy orders were heavily concentrated, and buy-side depth increased noticeably. Meanwhile, in the same period, market Mempool activity and on-chain transaction fees were at low levels, and trading activity declined—making the impact of large single transfers and buy orders on price more pronounced. At the same time, leveraged funds leaving the derivatives market and options’ “maximum pain” strike price being below the spot price increased the spot market’s sensitivity to volatility. With multiple factors converging, the short-term upward price impulse was amplified.
Currently, market liquidity risk is rising, and in the short term the price is dominated by large buy orders in the order book and on-chain whale liquidity. Traders should continue to monitor the direction of whale capital flows and changes in exchange reserves, and be alert to possible price pullbacks caused by capital returning. At the same time, the key support range (72,000–74,000 USDT), order book depth, and derivatives positioning structure remain the core monitoring indicators for near-term volatility. Investors should be mindful of the risks stemming from fragile short-term liquidity and keep an eye on more real-time market developments.
GateNews7m ago
Musk’s X introduces smart tags, driving $1 billion in global trading volume in 3 days
Musk’s social platform X rolled out a brand-new “Smart Cashtags” feature on the evening of April 15 (last Tuesday). On April 17, Nikita Bier, X’s product lead, announced that in just 3 days the feature drove about $1 billion in trading volume across global markets, based on aggregated data from X’s trading pilot program.
MarketWhisper22m ago
BTC 15-minute rise of 0.53%: Institutional derivatives adding positions drives a short-term rebound
Between 2026-04-20 01:30 and 2026-04-20 01:45 (UTC), the BTC spot price fluctuated within a narrow range of 74290.9 to 74709.7 USDT. Over the 15-minute period, the return was +0.53%, with a range of 0.56%. Overall market volatility increased, drawing attention, but the number of active on-chain addresses remained steady, with no sign of extreme capital movements.
The main driver behind this move is institutional capital inflows into mainstream futures platforms and adjustments to derivatives position structures, especially CME futures open interest (OI), which rose against the trend by 2.61%. Meanwhile, some institutions added to defensive hedges and positioned for short-term rebounds within the price consolidation range. In addition, short-term Put options trading on platforms such as Deribit was active: the main contracts were concentrated on near-term downside protection, indicating that derivatives capital has increased its allocation to defensive strategies and that the spot market has passively followed the upward move.
In addition, ETF funds recorded $1.87 billion in net inflows in Q1, easing the consecutive net outflow trend seen earlier before March and providing medium-term background support for spot prices. Although on-chain active addresses over 1 hour stayed in the 19500–19600 range without abnormal increases or decreases, structural behavior by institutions across the derivatives and ETF markets converged to push short-term price volatility higher. There were no signals of sell pressure from retail traders or major whales, and no large transfers or extreme liquidation events; overall momentum came from institutional-level maneuvering.
It is worth noting that the derivatives market Put/Call ratio remains on the high side. If the price cannot continue moving upward, short-term exit pressure could intensify at any time. With overall OI shrinking, the activity of leveraged funds in the market weakens. Going forward, it is important to focus on changes in derivatives positions, ETF fund flows, and the in-and-out movements of active capital on-chain in order to respond to the risk of sharp short-term volatility. For more market information, it is recommended to continuously track relevant data indicators and capital-level anomalies.
GateNews5h ago
BTC falls 0.44% in 15 minutes: ETF fund outflows and derivatives shorts add to the slide
From 21:45 to 22:00 (UTC) on April 19, 2026, the BTC price dropped by 0.44% within 15 minutes. The candlestick range was 74,366.1 to 74,789.3 USDT, with an amplitude of 0.57%. Short-term volatility was concentrated. During this period, the trading volume for large orders rose significantly, market attention increased, and volatility intensified.
The main driving force behind this deviation was that U.S. spot Bitcoin ETFs saw a large net outflow of $291 million over two days from April 18 to April 19. This reflected institutional funds pulling away in the short term, which led to a marked increase in sell pressure in the spot market. At the same time, BTC perpetual contract
GateNews8h ago
BTC falls below 74000 USDT
Gate News bot message, Gate market data shows that BTC has fallen below 74000 USDT, with a current price of 73979.6 USDT.
CryptoRadar8h ago
BTC dips slightly by 0.53% in 15 minutes: whale transfers increase sell pressure and amplified liquidity widen the short-term drop
From 17:45 to 18:00 (UTC) on 2026-04-19, within 15 minutes BTC’s spot price fell -0.53%, with a price range of 74648.4 to 75212.8 USDT and a swing of 0.75%. During this period, market attention increased, volatility clearly accelerated, and the magnitude of the abnormal move exceeded typical levels for the same timeframe.
The main driver behind this abnormal move was that large-whale accounts concentrated transfers of BTC to a certain major exchange; the All Exchanges Whale Ratio (EMA14) rose to a near-ten-month high, and sell pressure increased significantly in a short time, becoming a direct cause of the spot price decline.
GateNews12h ago
