
Key Takeaways
-
Bitcoin has dropped into a major 10-month support zone between $74,500–$78,600
-
The weekly chart shows a developing head and shoulders structure
-
BTC has corrected nearly 40% from its all-time high near $121,900
-
Reclaiming the 100-week MA around $87,263 could trigger a move toward $109,568
-
A breakdown below support may expose BTC to deeper downside toward the $49,000 region
Bitcoin has entered a critical phase in early February 2026, sliding into a zone that hasn’t been meaningfully tested in nearly ten months. After weeks of sustained selling pressure, BTC has dropped into the $74,500–$78,600 support range, an area that previously acted as a strong base during April-2025.
As of February 2, 2026, Bitcoin is trading near $76,614, down 2.24% over the past 24 hours, with an intraday low touching $74,551. On a broader scale, BTC is now down 12.45% year-to-date, erasing a large portion of the late-2025 rally and pushing market sentiment back into caution mode.
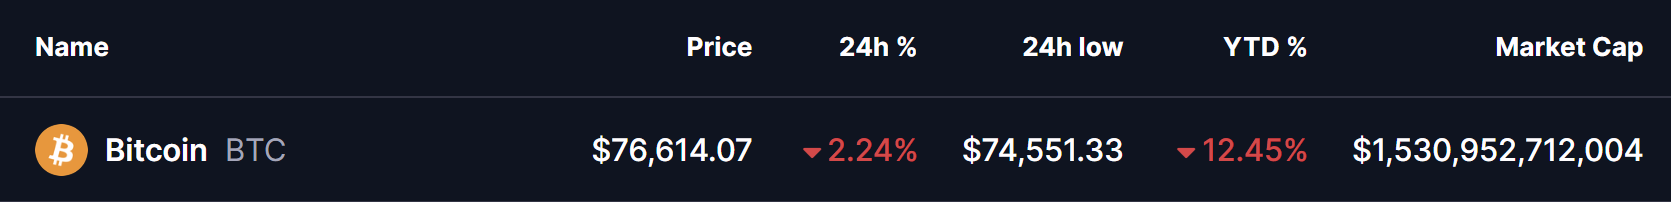
Source: Coinmarketcap
Yet, while price action looks heavy on the surface, the weekly chart structure suggests this move may be more than just panic-driven selling.
A Head and Shoulders Structure Near Completion
On the weekly timeframe, Bitcoin is carving out a developing head and shoulders pattern, a classic structure that often marks a major transition in trend. The “head” of the pattern formed near Bitcoin’s all-time high region around $121,900, from where BTC has corrected roughly 40% at its worst point.
The recent breakdown below the 100-week moving average, currently near $87,263, accelerated downside momentum and dragged price directly into the neckline support zone between $74,500 and $78,600.
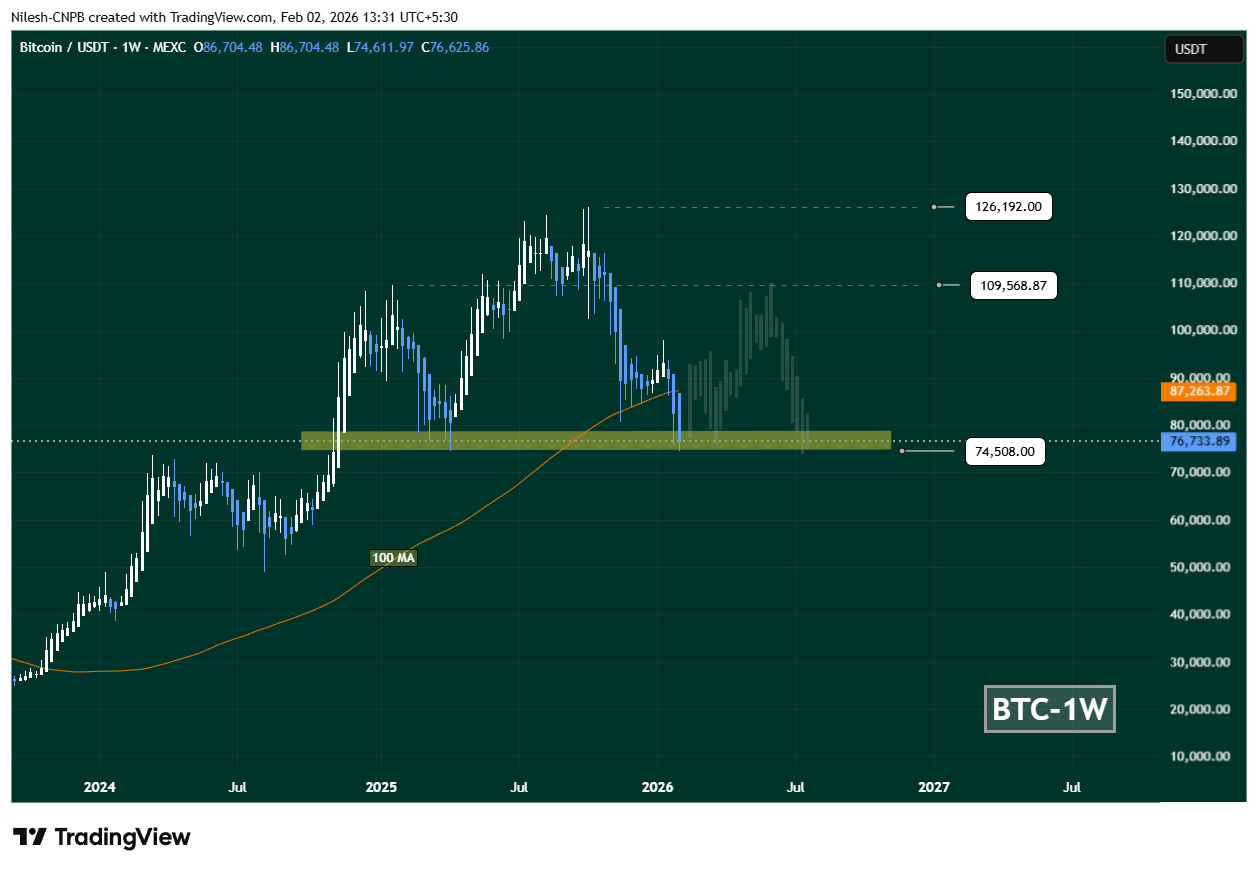
Bitcoin (BTC) Weekly Chart/Coinsprobe (Source: Tradingview)
This neckline is not just a random horizontal level. Historically, it has acted as a high-demand area, absorbing selling pressure and triggering strong rebounds. The latest weekly candle shows a clear downside wick into this zone, hinting that selling momentum may be weakening as buyers cautiously step in.
Liquidity Clusters Hint at a Potential Upside Magnet
Adding weight to the rebound narrative, Coinglass data highlights over $2.60 billion in liquidity stacked above the $87,000 region. This cluster creates a potential upside magnet if price manages to stabilize and reclaim key resistance levels.
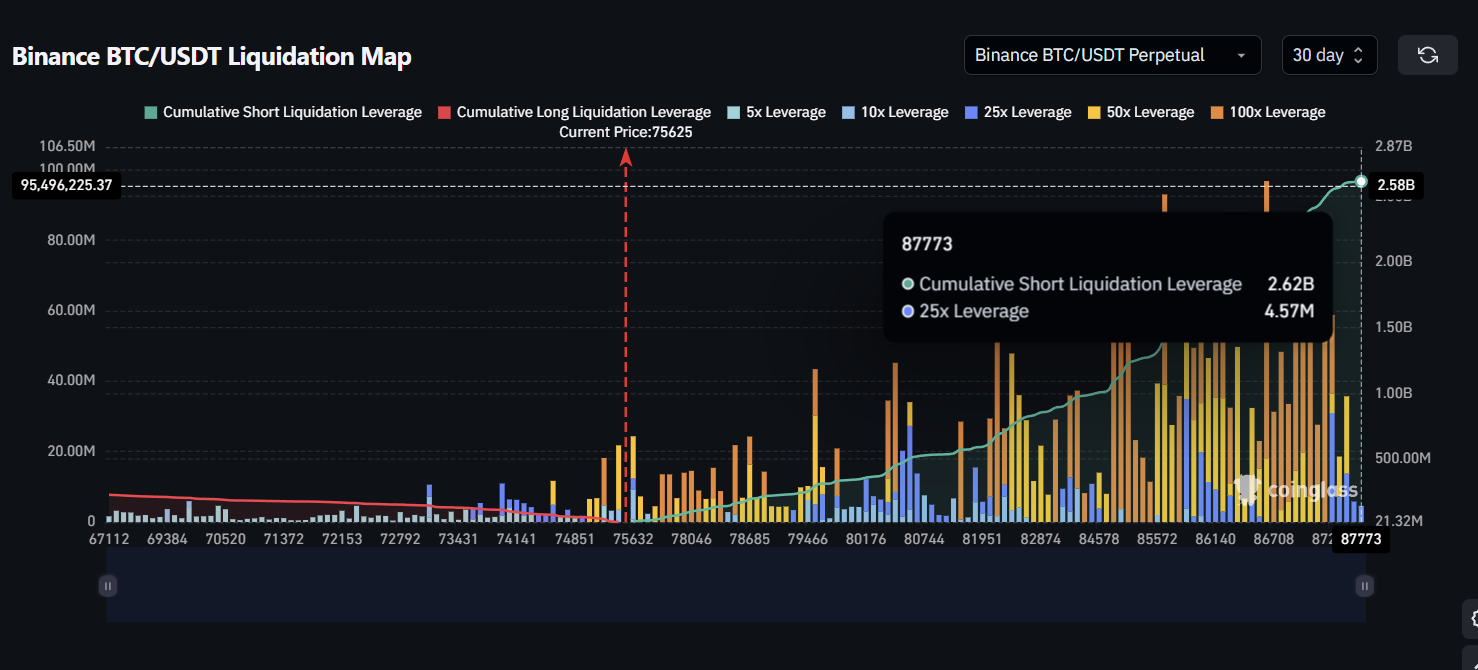
Source: Coinglass
From a market mechanics perspective, such liquidity zones often attract price once downside pressure cools, especially after a prolonged corrective move like the one Bitcoin has just experienced.
What the Chart Suggests Going Forward
If Bitcoin manages to defend the neckline support and reclaims the 100-week MA near $87,263, momentum could shift meaningfully in favor of bulls. In that scenario, a recovery toward the $109,568 region becomes technically plausible — representing a potential 40%+ upside move from current levels.
Such a rally would likely form the right shoulder of the larger head and shoulders structure, leaving BTC at a critical decision point between trend continuation or renewed consolidation.
On the flip side, failure to hold the $74,500–$78,600 zone would significantly weaken the structure. A clean breakdown below this area could open the door to a deeper correction toward the $49,000 region, where the next major liquidity pocket and historical support reside.
The Market’s Defining Moment
For now, Bitcoin is sitting at a make-or-break level. The neckline zone remains the battlefield where bulls and bears are actively fighting for control. How price reacts here will likely set the tone for the next major trend — whether that’s a relief rally driven by liquidity hunts or a continuation of the broader corrective phase.
One thing is clear: this is not a level the market can ignore.
Disclaimer: The views and analysis presented in this article are for informational purposes only and reflect the author’s perspective, not financial advice. Technical patterns and indicators discussed are subject to market volatility and may or may not yield the anticipated results. Investors are advised to exercise caution, conduct independent research, and make decisions aligned with their individual risk tolerance.
About Author: Nilesh Hembade is the Founder and Lead Author of Coinsprobe, with over 5 years of experience in the cryptocurrency and blockchain industry. Since launching Coinsprobe in 2023, he has been providing daily, research-driven insights through in-depth market analysis, on-chain data, and technical research.
Disclaimer: The information on this page may come from third parties and does not represent the views or opinions of Gate. The content displayed on this page is for reference only and does not constitute any financial, investment, or legal advice. Gate does not guarantee the accuracy or completeness of the information and shall not be liable for any losses arising from the use of this information. Virtual asset investments carry high risks and are subject to significant price volatility. You may lose all of your invested principal. Please fully understand the relevant risks and make prudent decisions based on your own financial situation and risk tolerance. For details, please refer to
Disclaimer.
Related Articles
BTC 15-minute rise of 0.53%: Institutional derivatives adding positions drives a short-term rebound
Between 2026-04-20 01:30 and 2026-04-20 01:45 (UTC), the BTC spot price fluctuated within a narrow range of 74290.9 to 74709.7 USDT. Over the 15-minute period, the return was +0.53%, with a range of 0.56%. Overall market volatility increased, drawing attention, but the number of active on-chain addresses remained steady, with no sign of extreme capital movements.
The main driver behind this move is institutional capital inflows into mainstream futures platforms and adjustments to derivatives position structures, especially CME futures open interest (OI), which rose against the trend by 2.61%. Meanwhile, some institutions added to defensive hedges and positioned for short-term rebounds within the price consolidation range. In addition, short-term Put options trading on platforms such as Deribit was active: the main contracts were concentrated on near-term downside protection, indicating that derivatives capital has increased its allocation to defensive strategies and that the spot market has passively followed the upward move.
In addition, ETF funds recorded $1.87 billion in net inflows in Q1, easing the consecutive net outflow trend seen earlier before March and providing medium-term background support for spot prices. Although on-chain active addresses over 1 hour stayed in the 19500–19600 range without abnormal increases or decreases, structural behavior by institutions across the derivatives and ETF markets converged to push short-term price volatility higher. There were no signals of sell pressure from retail traders or major whales, and no large transfers or extreme liquidation events; overall momentum came from institutional-level maneuvering.
It is worth noting that the derivatives market Put/Call ratio remains on the high side. If the price cannot continue moving upward, short-term exit pressure could intensify at any time. With overall OI shrinking, the activity of leveraged funds in the market weakens. Going forward, it is important to focus on changes in derivatives positions, ETF fund flows, and the in-and-out movements of active capital on-chain in order to respond to the risk of sharp short-term volatility. For more market information, it is recommended to continuously track relevant data indicators and capital-level anomalies.
GateNews1h ago
BTC falls 0.44% in 15 minutes: ETF fund outflows and derivatives shorts add to the slide
From 21:45 to 22:00 (UTC) on April 19, 2026, the BTC price dropped by 0.44% within 15 minutes. The candlestick range was 74,366.1 to 74,789.3 USDT, with an amplitude of 0.57%. Short-term volatility was concentrated. During this period, the trading volume for large orders rose significantly, market attention increased, and volatility intensified.
The main driving force behind this deviation was that U.S. spot Bitcoin ETFs saw a large net outflow of $291 million over two days from April 18 to April 19. This reflected institutional funds pulling away in the short term, which led to a marked increase in sell pressure in the spot market. At the same time, BTC perpetual contract
GateNews4h ago
BTC falls below 74000 USDT
Gate News bot message, Gate market data shows that BTC has fallen below 74000 USDT, with a current price of 73979.6 USDT.
CryptoRadar4h ago
BTC dips slightly by 0.53% in 15 minutes: whale transfers increase sell pressure and amplified liquidity widen the short-term drop
From 17:45 to 18:00 (UTC) on 2026-04-19, within 15 minutes BTC’s spot price fell -0.53%, with a price range of 74648.4 to 75212.8 USDT and a swing of 0.75%. During this period, market attention increased, volatility clearly accelerated, and the magnitude of the abnormal move exceeded typical levels for the same timeframe.
The main driver behind this abnormal move was that large-whale accounts concentrated transfers of BTC to a certain major exchange; the All Exchanges Whale Ratio (EMA14) rose to a near-ten-month high, and sell pressure increased significantly in a short time, becoming a direct cause of the spot price decline.
GateNews8h ago
BTC falls below 75,000 USDT
Gate News bot message, Gate quotes show that BTC has fallen below 75,000 USDT, with a current price of 74,985.2 USDT.
CryptoRadar8h ago
