XRP price has spent months moving sideways and lower, testing patience without offering clear direction. That slow grind explains why one technical level now carries so much weight. According to analysis shared by TheCryptoBasic and highlighted by market analyst Chart Nerd, the next move for XRP price does not require complex indicators or bold assumptions. A clean break above a long standing resistance line could be enough to shift momentum.
That resistance has shaped Ripple price behavior since mid 2025, and Chart Nerd believes the market keeps circling the same answer.
- XRP Price Faces A Defining Test Against Long Standing Resistance
- Ripple Price History Shows Why This Level Matters
- Failed Breakouts Continue To Shape XRP Price Direction
XRP Price Faces A Defining Test Against Long Standing Resistance
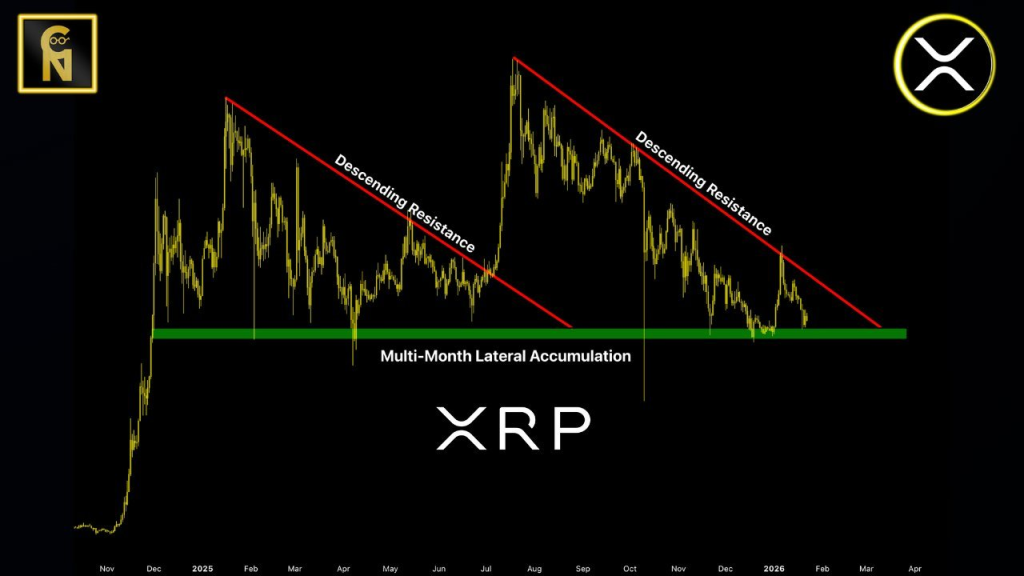
Chart Nerd’s analysis focuses on a descending trendline that has capped XRP price since July 2025. Every recovery attempt has stalled once price touched that line, turning optimism into another pullback. Current chart data places that resistance around $2.1, a level that now acts as the gateway for any meaningful trend change.
@thecryptobasic / X
XRP price currently trades near $1.91 after another failed recovery attempt earlier in January 2026. Chart Nerd argues that price action remains trapped until that trendline gives way. Sideways movement and short term volatility mean little without a decisive close above resistance.
Ripple Price History Shows Why This Level Matters
Earlier cycles show how powerful this pattern can be. Chart Nerd pointed out that before the recent downtrend, XRP price spent much of early 2024 consolidating around $0.50. Support held between $0.45 and $0.55, creating a base that later fueled a sharp rally.
That rally accelerated after the U.S. election. XRP price surged more than 500% between November 2024 and January 2025, climbing from $0.50 to $3.4. During that period, Ripple price built a strong accumulation zone between $1.7 and $1.9. Sellers regained control after the peak, and the first major resistance trendline emerged.
Failed Breakouts Continue To Shape XRP Price Direction
Several breakout attempts followed. March saw XRP price rebound above $3.02 after XRP was included in a U.S. crypto stockpile announcement. Resistance near $3 stopped that move, sending price down to $1.6 by April 2025. Another recovery in May reached $2.65 before meeting the same fate.
Chart Nerd noted that XRP price briefly broke above resistance in early July, which triggered a fresh uptrend. That move carried Ripple price to around $3.6 by July 18 before another pullback formed the current resistance trendline.
Two more attempts failed under that line. One peaked near $3.1 in October before a market wide crash pushed XRP price to $2.2. Another rally reached $2.41 on January 6, 2026, followed by another rejection.
SUI Price Is Reaching a Point That Can’t Be Ignored After Weeks Of Decline_**
Chart Nerd insists the solution remains straightforward. XRP price needs a decisive close above the descending trendline near $2.1. Until that happens, price action stays range bound as long as the multi month accumulation support remains intact.
Disclaimer: The information on this page may come from third parties and does not represent the views or opinions of Gate. The content displayed on this page is for reference only and does not constitute any financial, investment, or legal advice. Gate does not guarantee the accuracy or completeness of the information and shall not be liable for any losses arising from the use of this information. Virtual asset investments carry high risks and are subject to significant price volatility. You may lose all of your invested principal. Please fully understand the relevant risks and make prudent decisions based on your own financial situation and risk tolerance. For details, please refer to
Disclaimer.
Related Articles
Yesterday, the U.S. spot XRP ETF recorded a total net inflow of $9.0939 million in a single day
On April 10, the XRP spot ETF saw a net inflow of $9.0939 million in a single day. Of this, the Bitwise XRP ETF recorded a net inflow of $7.6149 million, and the Franklin XRP ETF recorded a net inflow of $1.4790 million. Total net asset value was $968 million, and the historical cumulative net inflow has reached $1.22B.
GateNews4h ago
Ethereum and XRP Price Momentum Fades While AlphaPepe Dominates As Best Crypto to Invest in April...
The ceasefire rally faded. Capital Street FX’s April 10 daily report confirmed it in numbers: Ethereum at $2,187 down 1.03%, XRP at $1.3449 down 0.87%. The momentum that the ceasefire briefly created lasted hours before the underlying conditions reasserted themselves. XRP has now posted six
BlockChainReporter7h ago
XRP Eyes $1.60 as April History Shapes Market Expectations
Key Insights:
XRP historical April data shows sharp gains and losses, with 2021 marking a 180% surge while recent years reflect declining monthly performance trends.
Current price consolidation between $1.28 and $1.36 suggests reduced volatility, signaling a potential breakout as traders mon
CryptoNewsLand12h ago
XRP Struggles Below $1.35 as Bearish Signals Build
XRP is under significant selling pressure after repeated rejections at resistance around $1.35. Weak momentum indicators and rising short interest suggest increased downside risk, with critical support at $1.30-$1.28. A break below this level could lead to further declines.
CryptoNewsLand12h ago
