
Key Highlights
-
A confirmed breakout could open the path toward the $176.97 region, offering meaningful upside potential.**Solana (SOL) **is showing renewed strength as the broader cryptocurrency market trades firmly in the green. Bitcoin is hovering near the $92,000 mark, while Ethereum is up nearly 2% at the time of writing — a supportive backdrop that has allowed select altcoins to regain momentum.
-
Solana (SOL) is up around 4% as the broader crypto market trades higher, supported by strength in Bitcoin and Ethereum.
-
Recent X (Twitter) Smart Cashtags integration for Solana tokens has boosted visibility and market sentiment.
-
SOL has reclaimed its 50-day moving average near $132, signaling improving short-term momentum.
-
Price is now testing a long-standing resistance zone between $142.70 and $146.91, a key decision area.
-
The daily chart shows a right-angled descending broadening formation, often associated with bullish reversals.
SOL itself is up around 4% on the day, building on optimism sparked by its recent partnership developments and an increasingly constructive technical setup. Price action on the daily chart now suggests that Solana may be nearing a decisive breakout point — one that could shape its next major directional move.
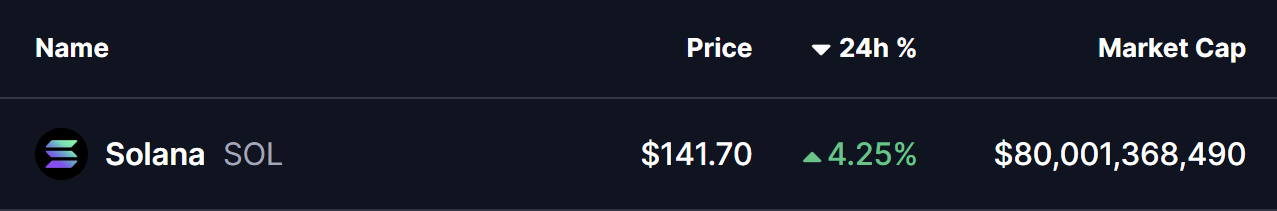
Source: Coinmarketcap
X (Twitter) Integration Boosts Sentiment
One of the most notable recent catalysts for Solana is its expanding integration with X (formerly Twitter). The platform is rolling out Smart Cashtags for Solana-based tokens, enabling users to share token symbols directly in posts, access real-time charts, and view related market data seamlessly within the app.
This development, teased and confirmed by the official @solana account on January 11, quickly gained traction and generated significant engagement across the crypto community. Beyond the immediate excitement, the integration reinforces Solana’s positioning within so-called “internet capital markets,” potentially increasing on-chain activity, visibility, and long-term adoption.
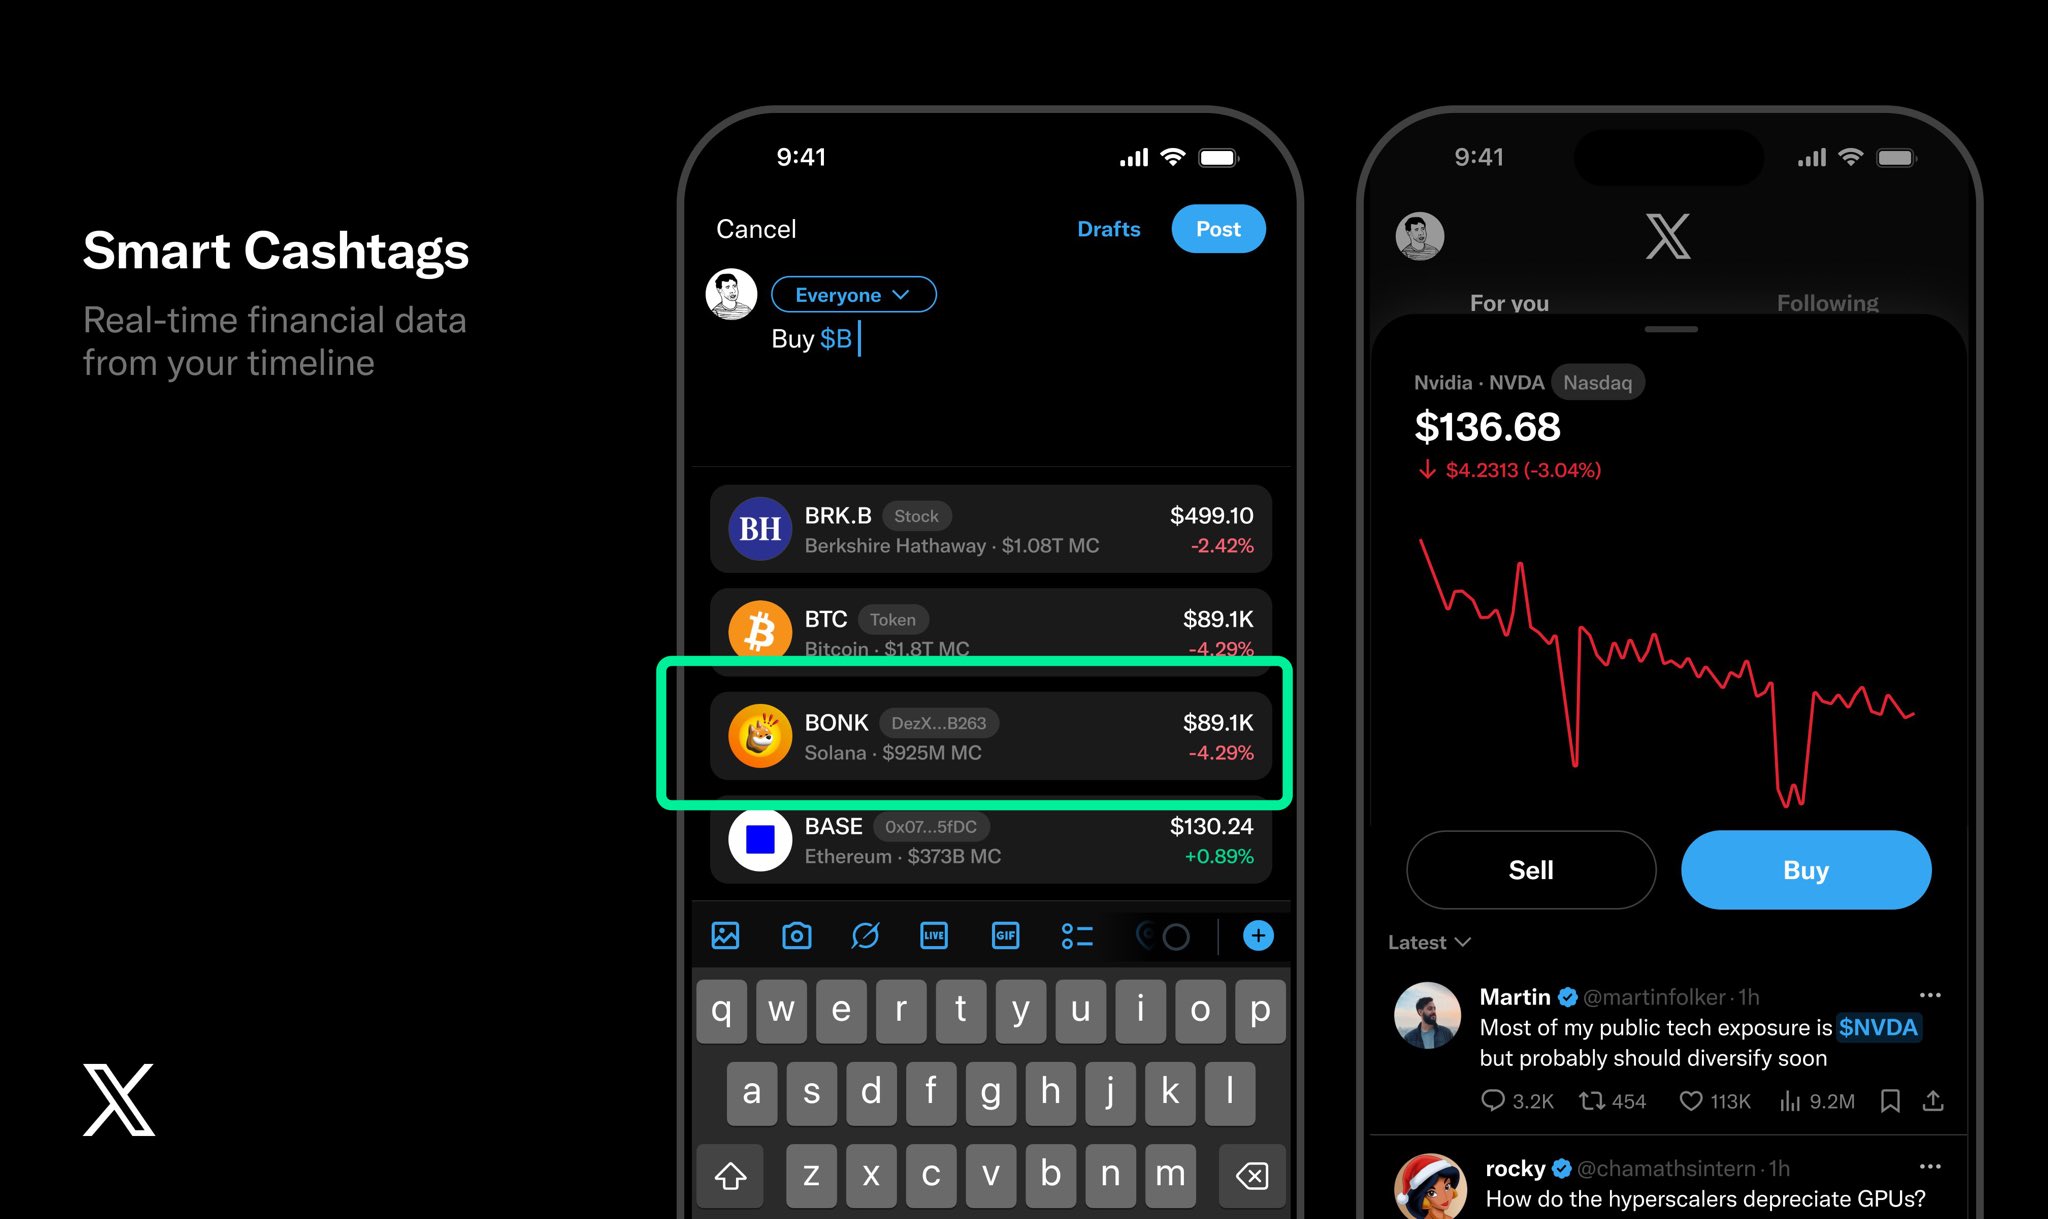
Source: @solana (X)
Right-Angled Descending Broadening Pattern in Play
From a technical standpoint, SOL’s daily chart reveals a right-angled descending broadening formation — a pattern often associated with bullish reversals following extended consolidation phases.
For several weeks, price action remained capped below the $142.70–$146.91 resistance zone, with each upward attempt facing rejection. Meanwhile, downside volatility expanded gradually, forming the characteristic widening structure of the pattern.
This behavior shifted after a strong rebound from the lower trendline. Buyers stepped in decisively, driving SOL higher and allowing it to reclaim the 50-day moving average near $132.06 — a level that had previously acted as persistent dynamic resistance. Regaining this moving average marked a notable change in short-term momentum.
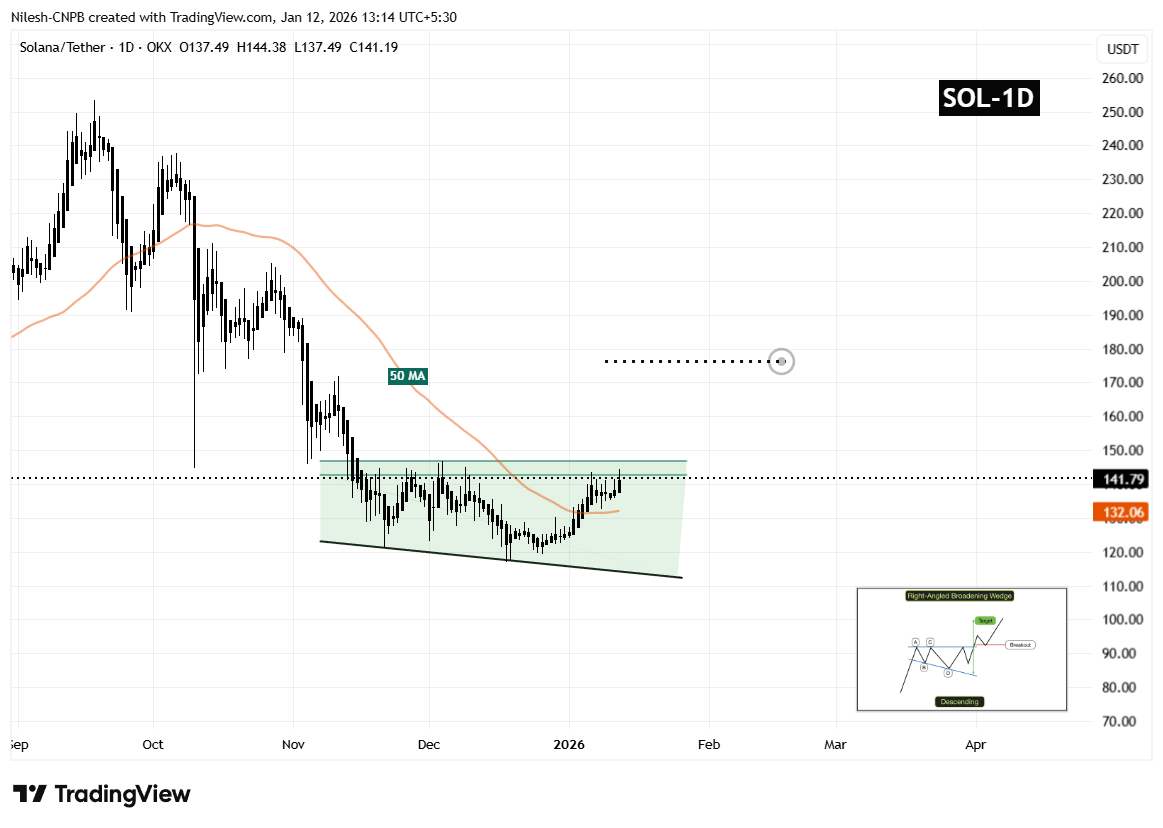
Solana (SOL) Daily/Chart /Coinsprobe (Source: Tradingview)
Since then, upside pressure has accelerated, bringing price back into the same resistance zone that previously halted advances. SOL now sits at a critical inflection area where bulls and bears are once again being tested.
What’s Next for SOL?
A decisive daily close above the $146.91 resistance would confirm a breakout from the descending broadening formation and validate the broader bullish reversal structure. Acceptance above this zone would likely attract fresh momentum-driven participation, as traders recognize the shift in market structure.
Based on the depth of the pattern and its measured-move projection, a confirmed breakout could open the door toward the $176.97 region. From current levels, this implies a potential upside of approximately 24%, consistent with post-breakout expansions typically seen from this setup.
That said, caution remains warranted until confirmation occurs. Short-term pullbacks — including a potential retest of the 50-day moving average — remain possible and would not invalidate the bullish thesis as long as higher lows continue to form.
For now, the $142.70–$146.91 zone stands as the defining decision area. How SOL behaves around this region will determine whether it transitions into a sustained bullish phase or remains range-bound in the near term.
Bottom Line
Solana is approaching a critical technical and narrative-driven inflection point. The combination of improving market conditions, growing social media integration through X, and a bullish reversal pattern on the daily chart places SOL in a strong position for a potential breakout. However, confirmation remains essential. A sustained daily close above the $146.91 resistance zone would validate the bullish setup, while failure to break through could lead to further consolidation. Until that breakout is confirmed, the current zone remains the key battleground to watch.
Frequently Asked Questions (FAQ)
What chart pattern is forming on Solana’s daily chart?
Solana is forming a right-angled descending broadening pattern on the daily timeframe, a structure that often signals a potential bullish reversal after prolonged consolidation.
Why is the $142.70–$146.91 zone important for SOL?
This zone has acted as strong resistance multiple times in recent weeks. A decisive daily close above it would confirm a breakout and signal a shift toward bullish continuation.
What role does the 50-day moving average play in SOL’s setup?
The 50-day moving average near $132 recently flipped from resistance to support. Reclaiming this level suggests improving momentum and strengthens the bullish case.
How could the X (Twitter) integration impact Solana’s price?
The Smart Cashtags integration increases visibility and accessibility of Solana tokens on social media, potentially driving higher engagement, on-chain activity, and long-term demand.
What is the upside target if SOL breaks out?
If SOL confirms a breakout above resistance, the pattern’s measured move projects a potential upside toward the $176.97 region, representing roughly 24% upside from current levels.
Disclaimer: The views and analysis presented in this article are for informational purposes only and reflect the author’s perspective, not financial advice. Technical patterns and indicators discussed are subject to market volatility and may or may not yield the anticipated results. Investors are advised to exercise caution, conduct independent research, and make decisions aligned with their individual risk tolerance.
About Author: Nilesh Hembade is the Founder and Lead Author of Coinsprobe, with over 5 years of experience in the cryptocurrency and blockchain industry. Since launching Coinsprobe in 2023, he has been providing daily, research-driven insights through in-depth market analysis, on-chain data, and technical research.
Disclaimer: The information on this page may come from third parties and does not represent the views or opinions of Gate. The content displayed on this page is for reference only and does not constitute any financial, investment, or legal advice. Gate does not guarantee the accuracy or completeness of the information and shall not be liable for any losses arising from the use of this information. Virtual asset investments carry high risks and are subject to significant price volatility. You may lose all of your invested principal. Please fully understand the relevant risks and make prudent decisions based on your own financial situation and risk tolerance. For details, please refer to
Disclaimer.
