
Date: Fri, Jan 02, 2026 | 09:15 AM GMT
The broader cryptocurrency market has started the new year on a stable footing, with both Bitcoin (BTC) and Ethereum (ETH) trading slightly higher and posting gains of over 1.5%. This modest strength across major assets has provided breathing room for risk-on sentiment, allowing several memecoins to show early signs of recovery — including Popcat (SOL) (POPCAT).
POPCAT is currently trading by solid 19% higher on the day, but the more important development lies in its broader technical structure. After months of consistent downside pressure, the price action is now beginning to hint at a potential trend reversal, supported by a well-defined bullish pattern forming on the daily chart.
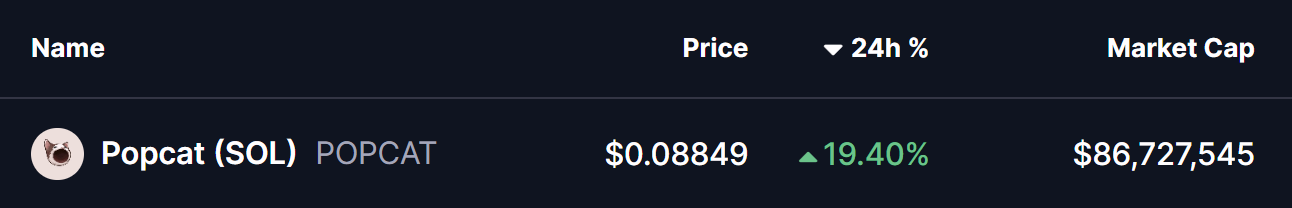
Source: Coinmarketcap
Falling Wedge Pattern in Play
On the daily timeframe, POPCAT appears to be carving out a falling wedge formation — a classic bullish reversal pattern that often develops after extended downtrends. This structure is characterized by lower highs and lower lows that gradually converge, reflecting weakening selling pressure and growing buyer interest near the lows.
Following weeks of steady decline, POPCAT recently established a local bottom near the $0.0725 region. This area acted as a strong demand zone, where buyers stepped in aggressively and prevented further downside. The resulting rebound pushed price back toward the $0.088 level, placing POPCAT just beneath the wedge’s upper resistance trendline.
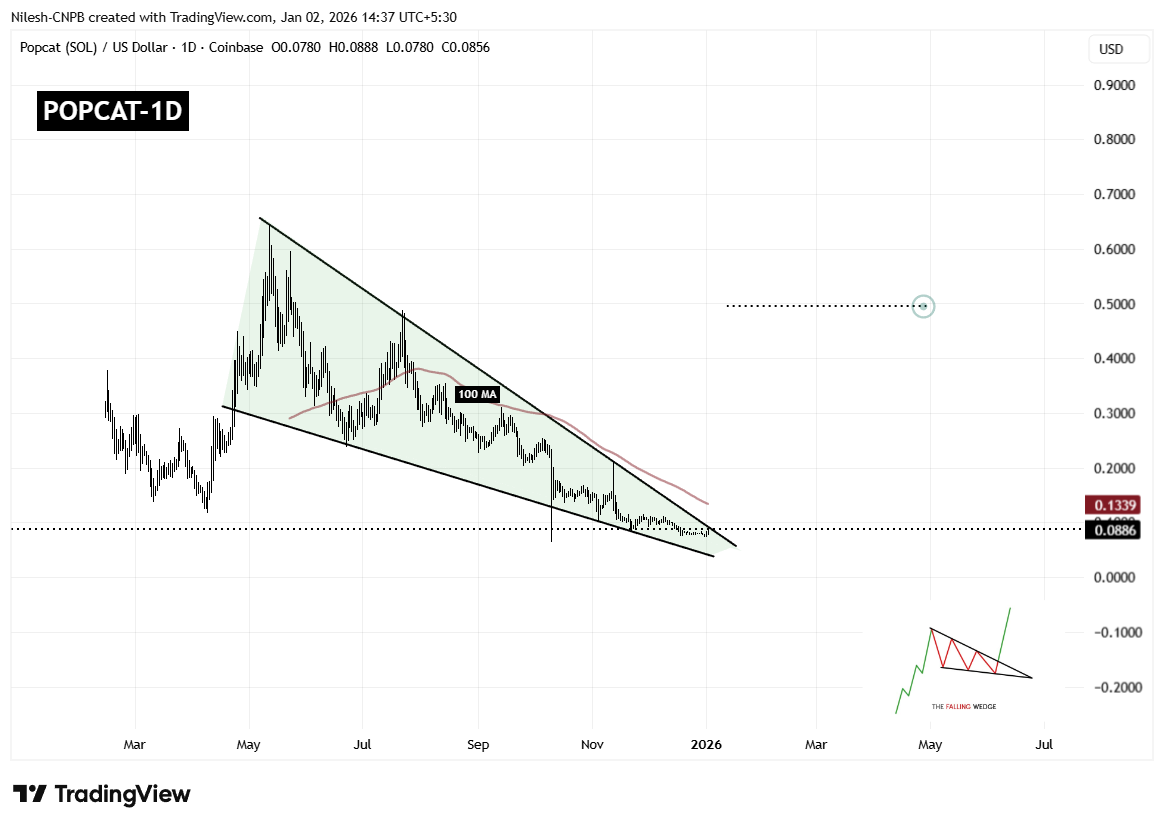
Popcat (POPCAT) Daily Chart/Coinsprobe (Source: Tradingview)
This compression near resistance is technically significant, as falling wedges tend to resolve with a sharp upside move once price breaks out of the structure. The longer price coils within the wedge, the stronger the eventual breakout tends to be.
However, overhead resistance remains notable. The 100-day moving average, currently hovering around $0.1339, represents a major technical barrier. This level has previously acted as dynamic resistance and will likely be a key area to watch if a breakout occurs.
What’s Next for POPCAT?
If buyers manage to push price decisively above the wedge resistance and reclaim the 100-day moving average with a strong daily close, POPCAT could confirm a bullish breakout. Such a move would mark a clear shift in trend structure and could open the door for a larger recovery rally.
Based on the measured move of the falling wedge pattern, the upside projection points toward the $0.49 region. Reaching this level would represent a substantial recovery from current prices and could attract renewed interest from momentum traders and sidelined participants.
That said, failure to break above resistance could result in continued consolidation. In a bearish scenario, POPCAT may revisit the $0.072 support zone once again. As long as this level continues to hold, the broader falling wedge structure would remain intact, keeping the bullish reversal thesis alive.
Overall, POPCAT is approaching a technically critical juncture. With price tightly compressed, selling pressure fading, and buyers defending key support levels, the coming sessions could prove decisive in determining whether this memecoin is ready to stage its next meaningful move higher.
Disclaimer: The views and analysis presented in this article are for informational purposes only and reflect the author’s perspective, not financial advice. Technical patterns and indicators discussed are subject to market volatility and may or may not yield the anticipated results. Investors are advised to exercise caution, conduct independent research, and make decisions aligned with their individual risk tolerance.
About Author: Nilesh Hembade is the Founder and Lead Author of Coinsprobe, with over 5 years of experience in the cryptocurrency and blockchain industry. Since launching Coinsprobe in 2023, he has been providing daily, research-driven insights through in-depth market analysis, on-chain data, and technical research.

Disclaimer: The information on this page may come from third parties and does not represent the views or opinions of Gate. The content displayed on this page is for reference only and does not constitute any financial, investment, or legal advice. Gate does not guarantee the accuracy or completeness of the information and shall not be liable for any losses arising from the use of this information. Virtual asset investments carry high risks and are subject to significant price volatility. You may lose all of your invested principal. Please fully understand the relevant risks and make prudent decisions based on your own financial situation and risk tolerance. For details, please refer to
Disclaimer.
Related Articles
Bitcoin surges toward 79K, Trump extends the ceasefire deal, and optimistic earnings lift U.S. stocks to fresh record highs
The S&P and the Nasdaq hit fresh highs again yesterday, boosted by the extension of the U.S.-Iran ceasefire and upbeat earnings reports. Crypto prices moved higher in tandem; BTC briefly surged to $79,472 and ETH rose above $2,400, with a 24-hour gain of 3.04%. Bitcoin saw large liquidations totaling $421 million; if it can hold the 78.1K real value, it may be poised to break above 80K, showing bullish momentum.
ChainNewsAbmedia30m ago
ADA Price Outlook as Cardano Lands LSE Tokenized Deal
Key Insights
Cardano tokenized a Hannover Re reinsurance product and listed it on the London Stock Exchange, expanding blockchain use in regulated institutional markets.
ADA price holds within a descending wedge as support at $0.2400 remains intact while resistance near $0.2550 and $0.2824 l
CryptoNewsLand4h ago
SUI Price Eyes $1.10 Breakout as Whale Positions Rise
Key Insights
SUI trades at $0.96 with RSI at 53.66, showing neutral momentum while maintaining upside room for expansion toward resistance levels.
Whale positioning at 70% long signals strong institutional confidence, aligning with rising open interest and steady capital inflows despite
CryptoNewsLand4h ago
Shiba Inu Open Interest Surges 13.45% in 24 Hours as Futures Activity Accelerates
SHIB open interest rose 13.45% to $69.79M with price up ~3% to $0.000006231. Futures inflows higher; volumes surged. Technicals show 50-day MA support, RSI 55, MACD bullish; potential move beyond 0.000010.
Abstract: This report reviews SHIB market activity on Gate News as of April 22. SHIB open interest rose 13.45% to $69.79 million, with the price up about 3% to $0.000006231. Futures inflows exceeded outflows and total volumes rose, while spot and futures taker data showed mixed biases. Technically SHIB found support near the 50-day MA, RSI sits at 55, and the MACD turned positive, signaling a potential breakout and a possible rally beyond the $0.000010 level after a confirmed channel breakout.
GateNews5h ago
Shiba Inu Breakout Gains Strength as Volume Surges
Key Insights
Shiba Inu’s breakout above the triangle pattern gains strength as rising volume and higher lows confirm growing demand and a sustained bullish market structure shift.
Derivatives activity jumps significantly with volume surpassing $249 million while open interest rises,
CryptoNewsLand6h ago
XRP Price Near $1.45 as ETF Inflows Build Pressure
Key Insights
Institutional XRP ETF inflows reached $41.6 million over four days, lifting assets under management above $1.08 billion and strengthening market confidence.
XRP faces strong resistance near $1.45, where CoinGlass data highlights a short max
CryptoNewsLand6h ago