The price of Bitcoin has recently fallen from its all-time high (ATH), indicating that the market may be entering a transformative phase. Although this drop seems normal, it may signal underlying concerns about future volatility.
Historical data suggests that a “volatility boom” may be approaching, causing many large investors to gradually shift to a neutral stance.
Bitcoin: The Calm Before the Storm
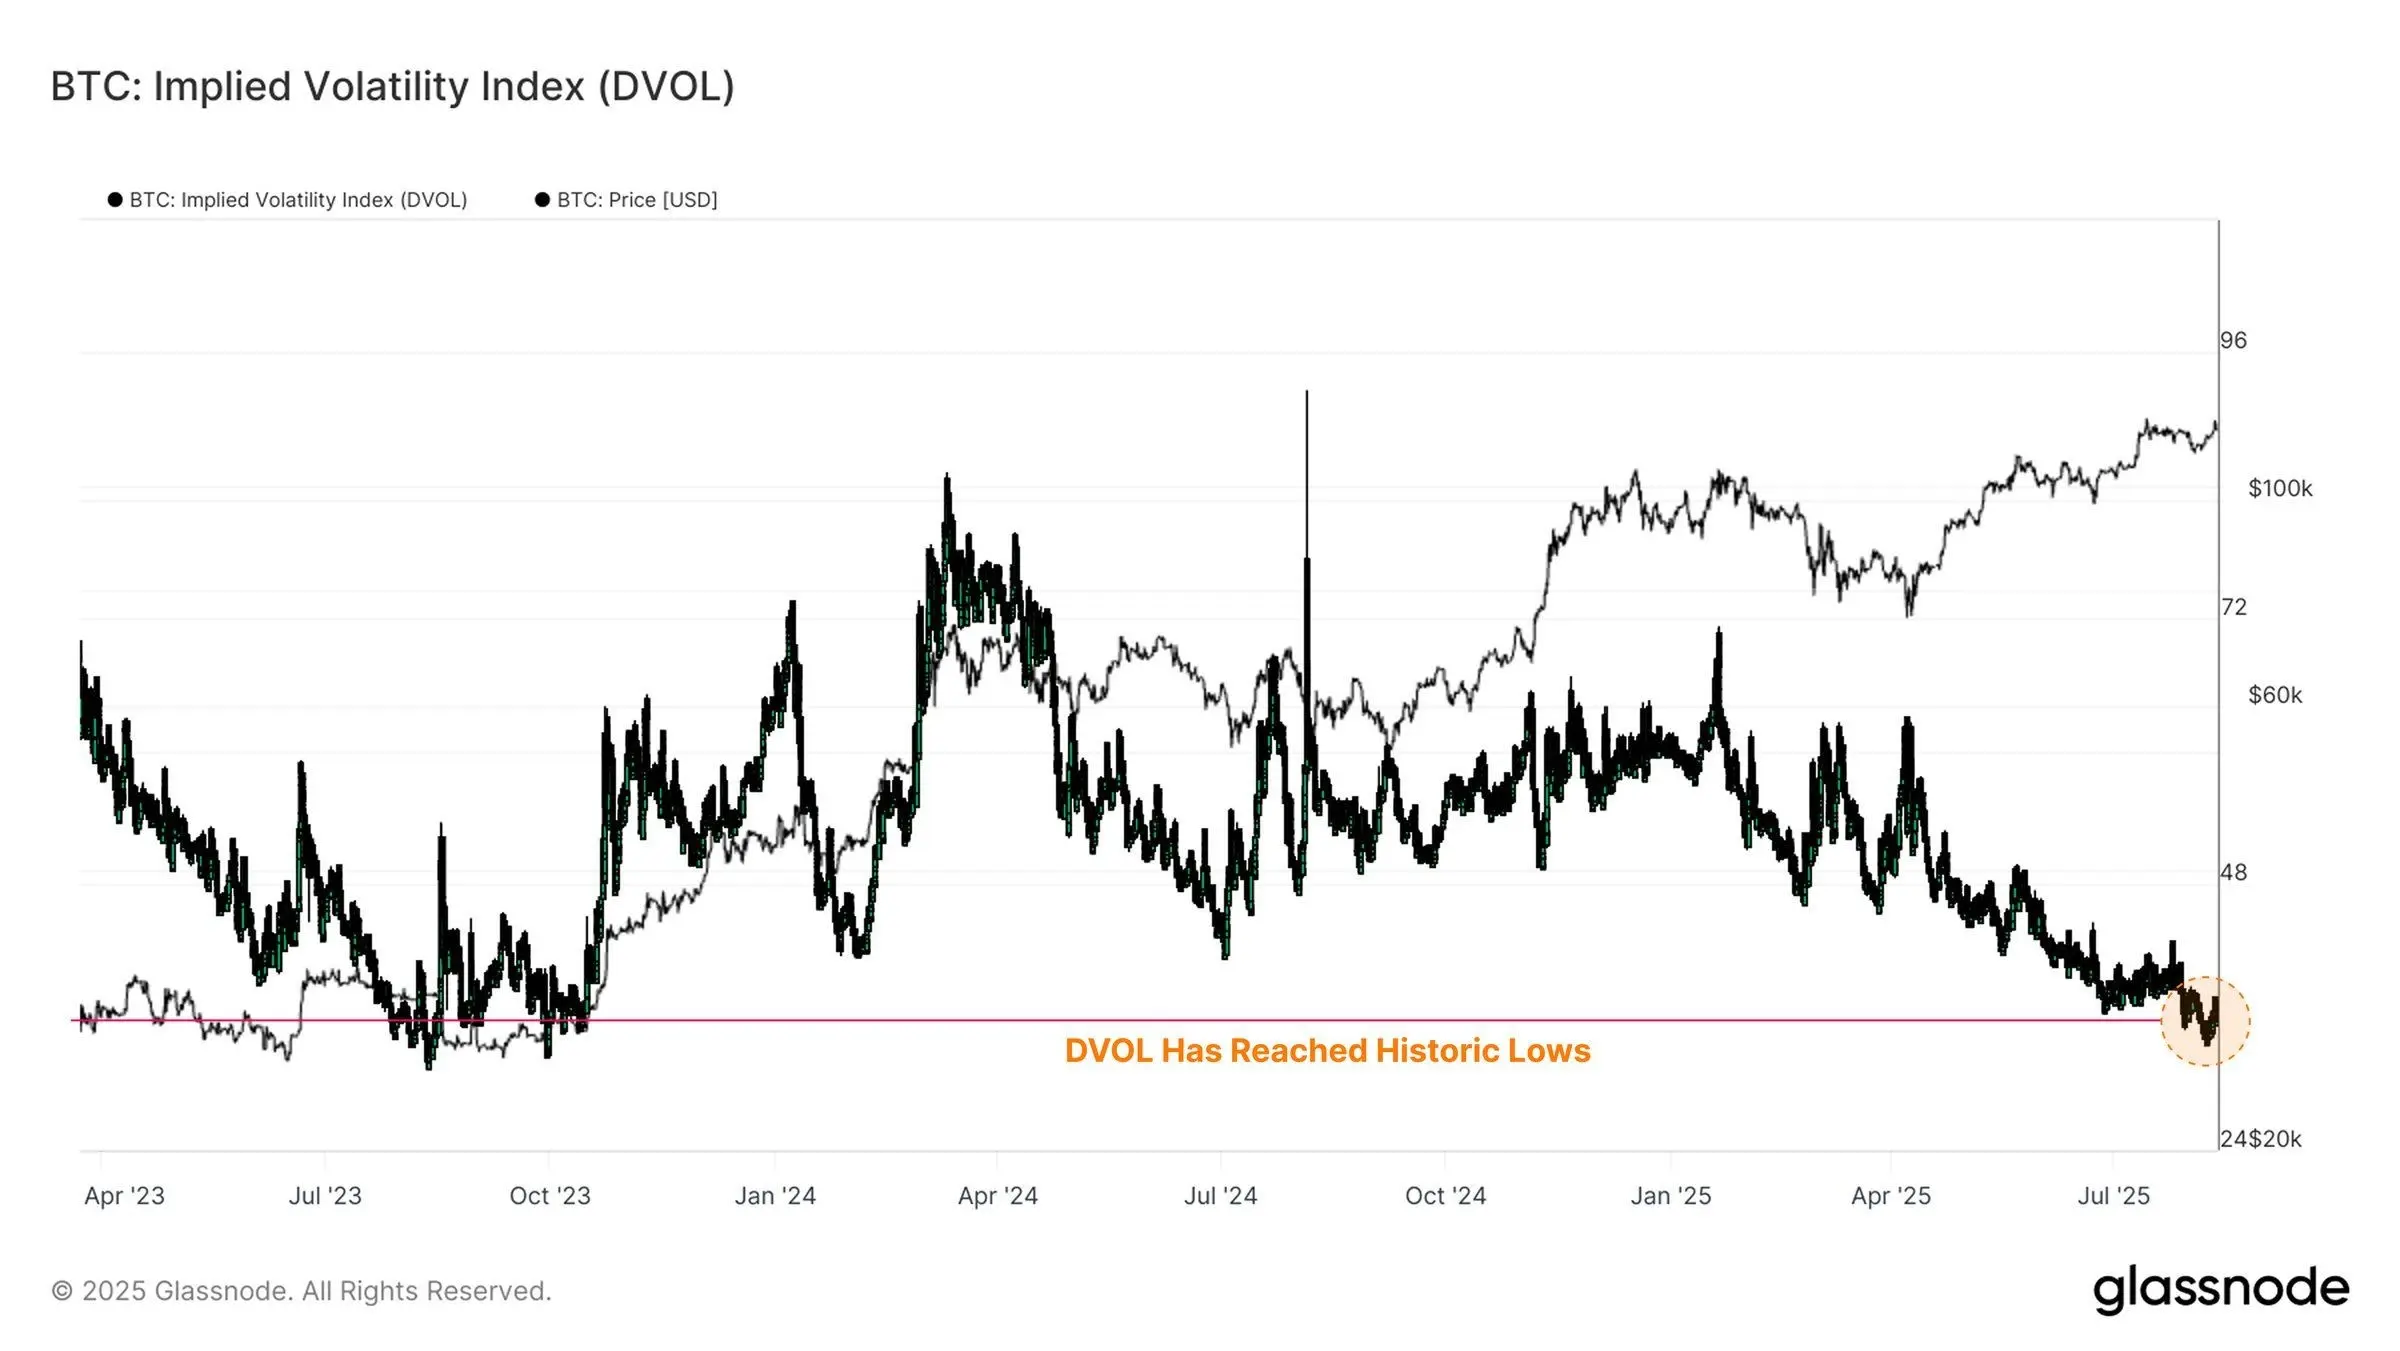
The DVOL index of Bitcoin ( is a tool for measuring the volatility of this asset ) and is currently at a record low. Only 2.6% of days in history have recorded lower values, indicating extreme complacency in the market. This means that investors are hardly hedging against the risk of decline, and if an unexpected event occurs, strong volatility will trigger large price swings.
DVOL measures the expected price volatility in the coming month and the current low indicates that traders are quite optimistic and comfortable. However, this calm will not last, as shocks often occur right after a period of complacency. If the market suddenly faces a setback, Bitcoin could witness strong price fluctuations, which may catch investors off guard.
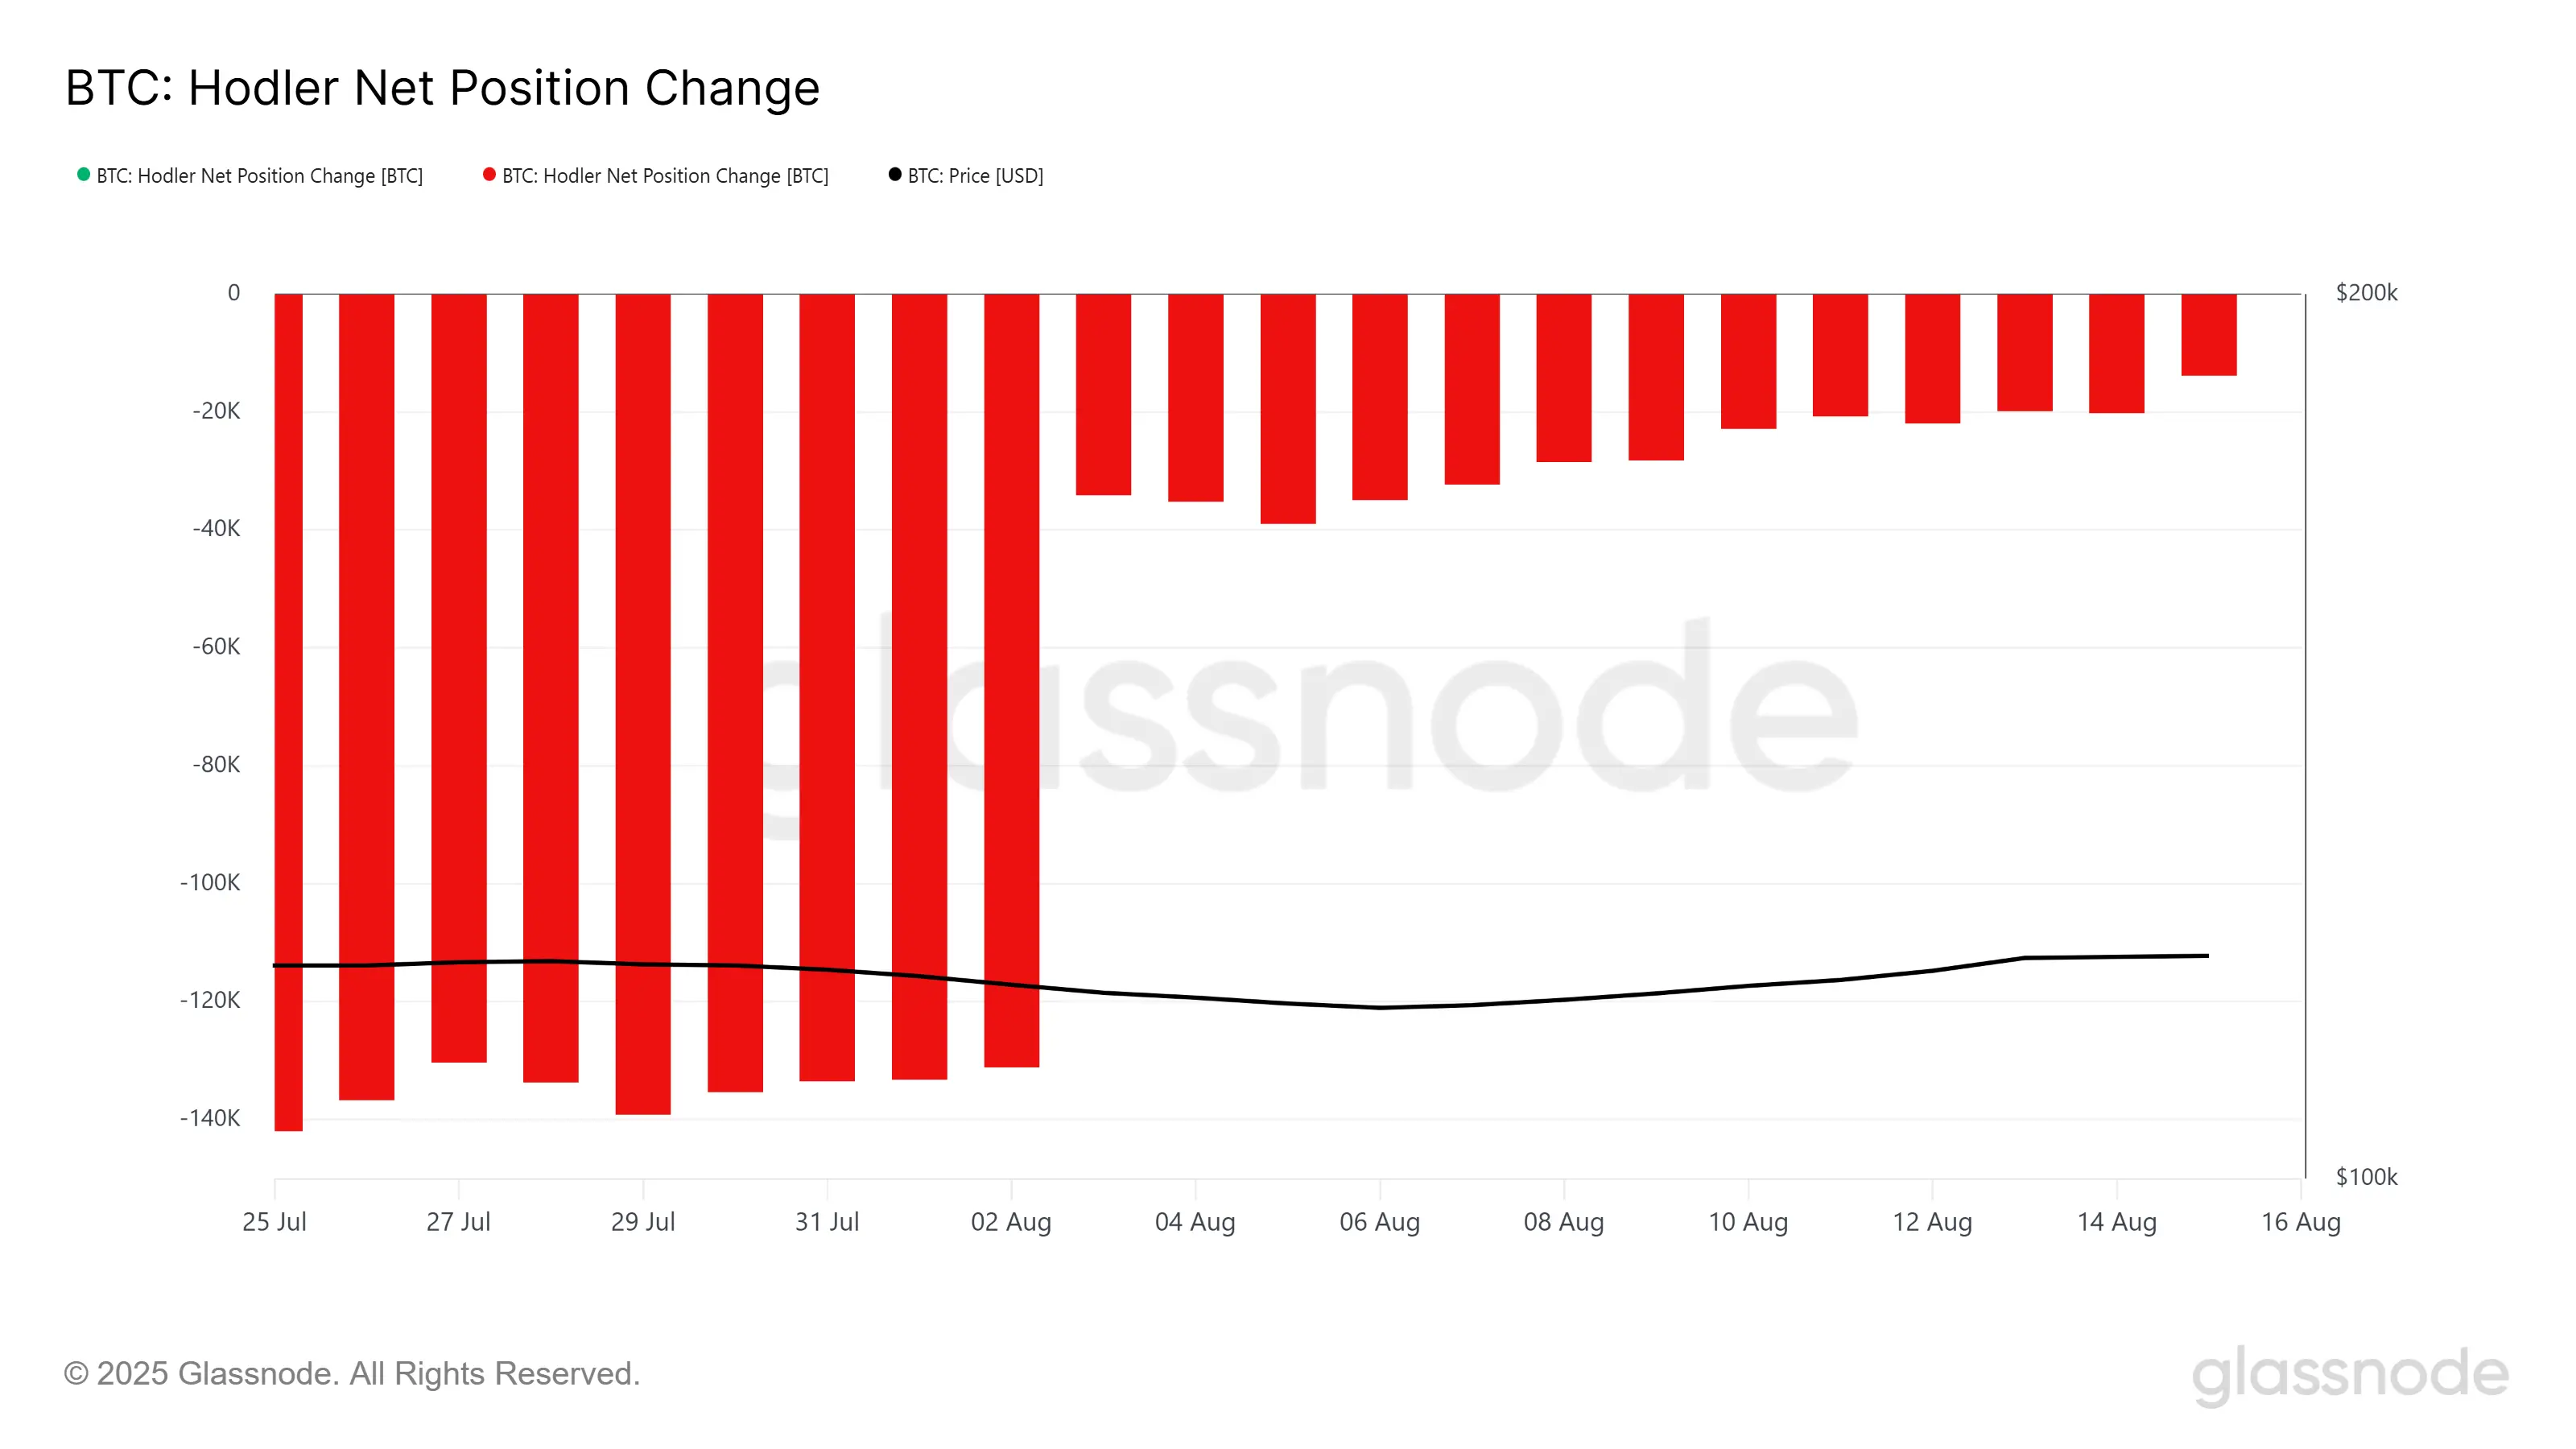
 The DVOL index of Bitcoin | Source: GlassnodeThe overall macro momentum of Bitcoin shows a notable change in investor behavior. The net position change index of holders has slowed down, reflecting a decrease in activity from long-term holders (LTH). Although LTH began accumulating from the beginning of the month, this buying trend has now paused, perhaps due to the prevailing uncertainty in the market.
Although there are no new buying activities, the absence of selling pressure indicates a certain level of optimism from this group. They seem to be waiting for clearer signals about the direction of the market before taking further action. This implies that LTH is being cautious but still expects that any strong fluctuations could lead to price increases, so currently, they are maintaining their holding position.
 Change the net position of the holder | Source: Glassnode## Price of Bitcoin may hold the support area
Throughout the past month, the price of Bitcoin has maintained an upward trend, but this momentum has stalled in the last 24 hours as BTC fell to 117,618 dollars. The decline occurred after the price slipped below the upward trend line, signaling a shift in market sentiment.
If investors continue to hold their positions during the upcoming volatility, Bitcoin may stabilize around the $117,000 mark. This will open up the opportunity to break through to the $120,000 range, turning this level into support and providing momentum for the next upward trend.
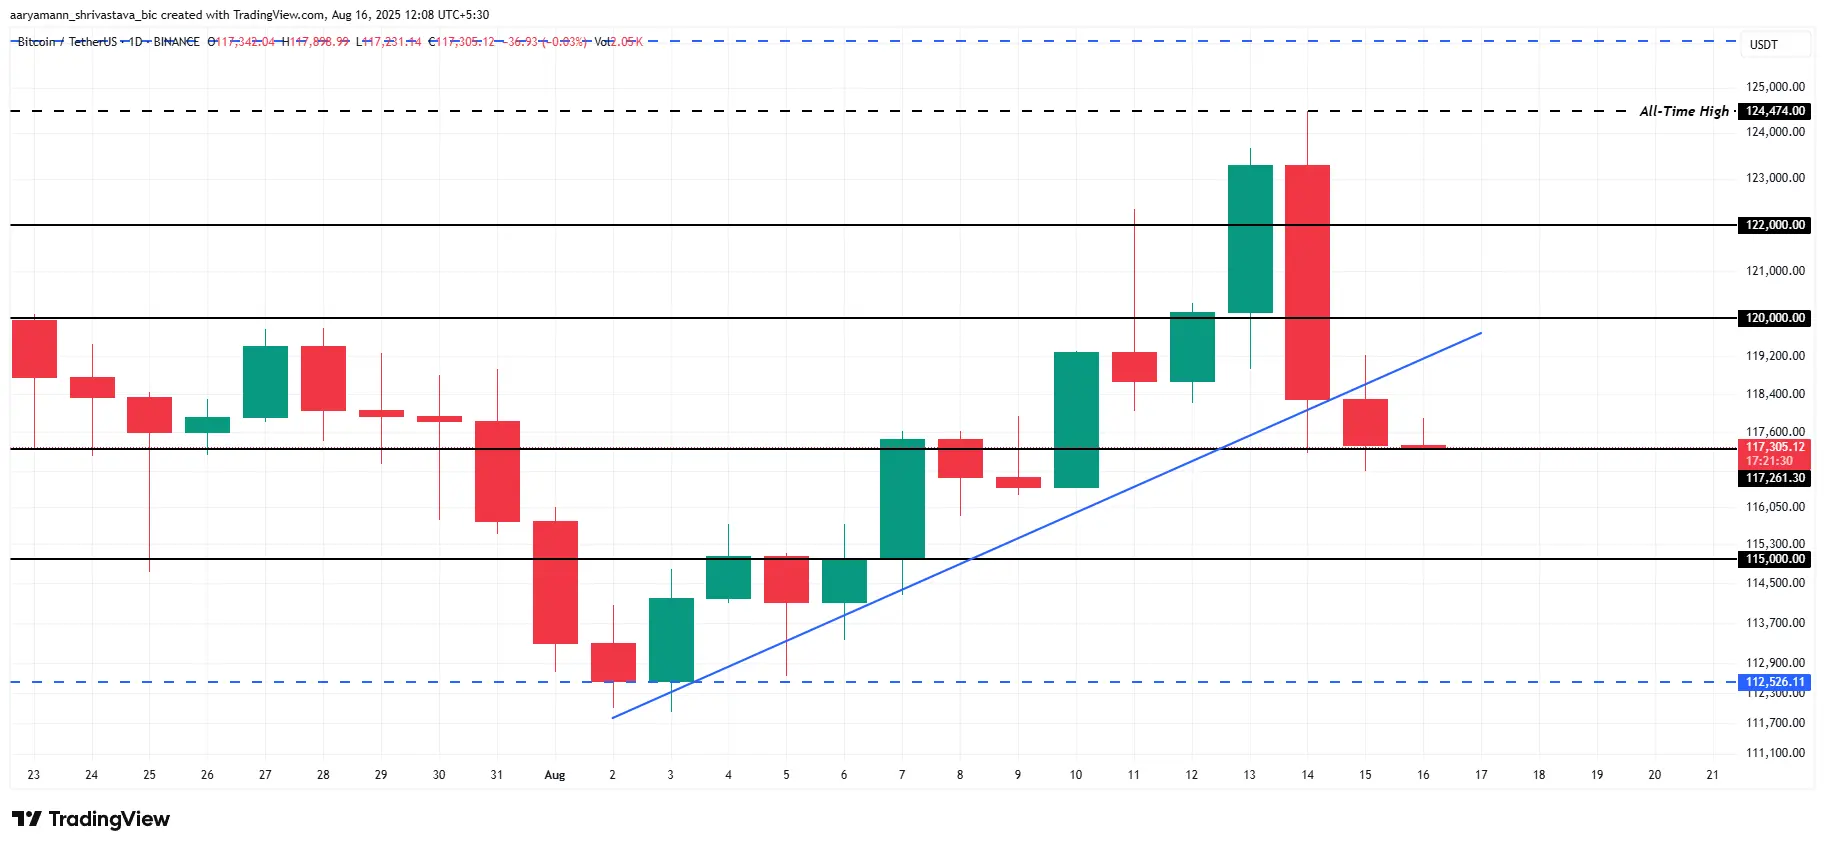 Bitcoin price chart | Source: TradingViewHowever, if investor sentiment turns bearish and selling pressure increases due to volatility, Bitcoin may face a sharp fall. In this scenario, the price could break through the support level of $115,000 and drop to a low of around $112,526. This would erase all the gains made in August and negate the previous bullish outlook.
Dinh Dinh
Disclaimer: The information on this page may come from third parties and does not represent the views or opinions of Gate. The content displayed on this page is for reference only and does not constitute any financial, investment, or legal advice. Gate does not guarantee the accuracy or completeness of the information and shall not be liable for any losses arising from the use of this information. Virtual asset investments carry high risks and are subject to significant price volatility. You may lose all of your invested principal. Please fully understand the relevant risks and make prudent decisions based on your own financial situation and risk tolerance. For details, please refer to
Disclaimer.
