 Solana (SOL) is making efforts to recover after a nearly 12% correction over the past week, with the RSI index soaring into the overbought territory, reflecting a significant price increase. However, the BBTrend remains very negative despite signs of weakening, indicating that the market is gradually stabilizing.
Meanwhile, the EMA lines are approaching a potential Golden Cross, signaling a possible trend reversal if key resistance levels are broken. However, with Ethereum surpassing Solana in DEX volume for the first time in 6 months and important support levels just below, SOL has not yet fully escaped the risk of a deeper correction.
RSI SOL is currently at an overbought level
The Relative Strength Index (RSI) of Solana has surged to 72.91, a significant increase from 38.43 just a day earlier, indicating a rapid shift in momentum from the neutral zone to a strong bullish zone.
RSI is a widely used momentum oscillator that measures the speed and magnitude of price changes on a scale from 0 to 100. Readings above 70 typically indicate that an asset is overbought, increasing the risk of a correction. Conversely, a level below 30 signals oversold conditions and may present a recovery opportunity.
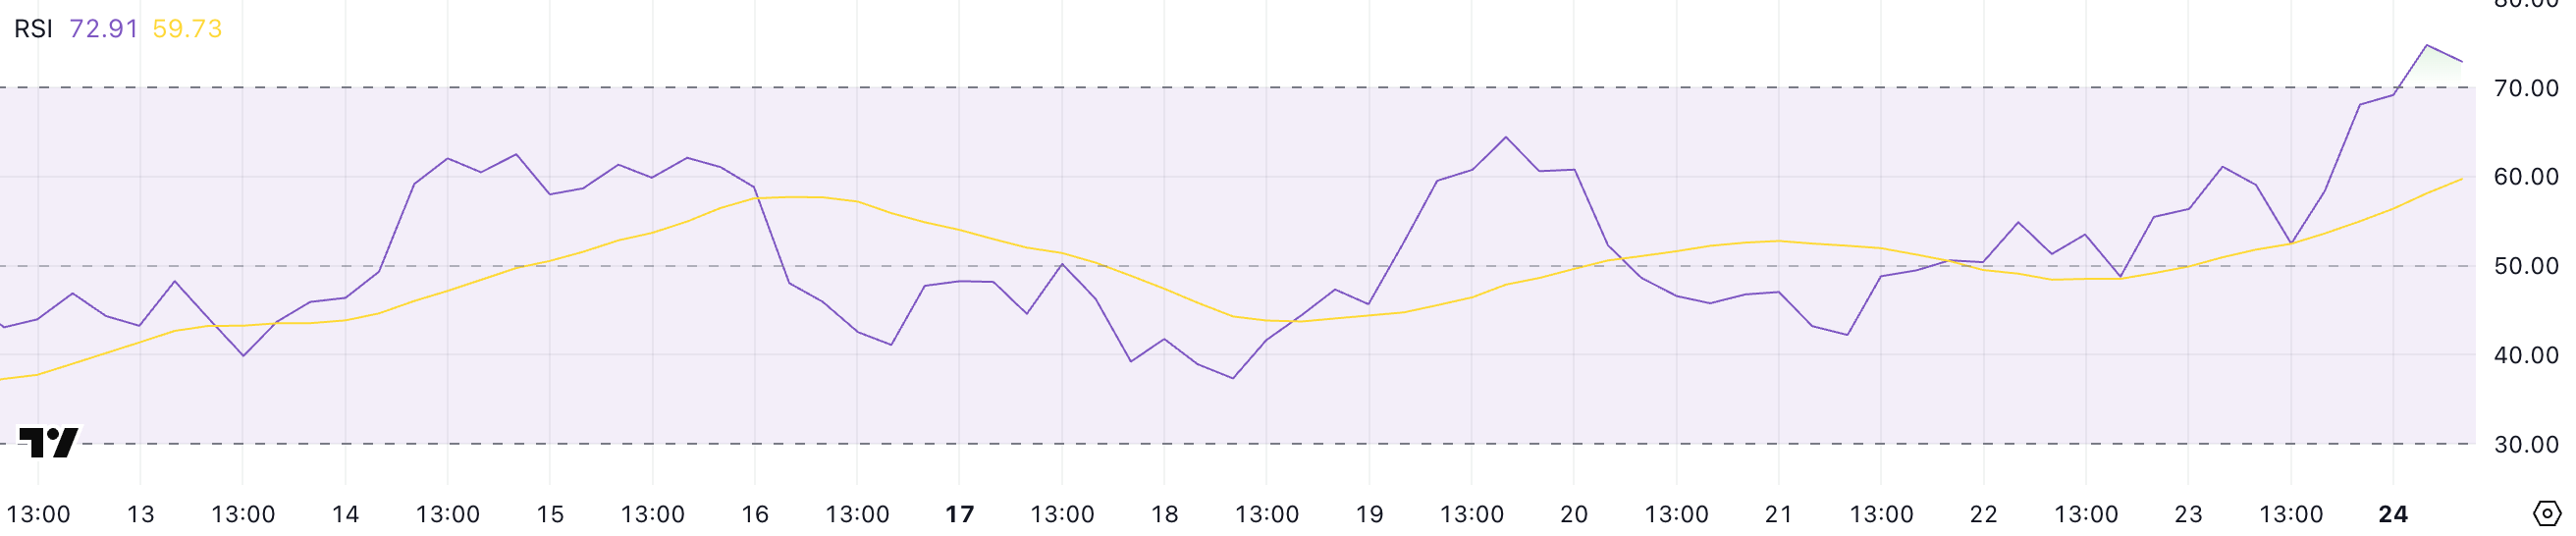 SOL RSI | Source: TradingViewWith Solana’s RSI currently exceeding 70, this asset has officially entered the overbought zone, reflecting strong buying pressure in the short term. Although this can sometimes foreshadow a correction or consolidation, it can also signify the beginning of a breakout bullish trend.
Traders should closely monitor signals of continuation or exhaustion. If the upward momentum is maintained, Solana may rise higher. Conversely, any signs of weakness could trigger a wave of profit-taking, leading to significant volatility in the short term.
BBTrend Solana is declining, but the value is still very negative
The BBTrend indicator of Solana has slightly increased to -11.18 after hitting a low of -12.68 earlier today. This indicates that the downtrend is starting to weaken.
BBTrend (Bollinger Band Trend) measures the strength and direction of a trend based on how the price interacts with the Bollinger Band. Values below -10 often indicate strong downward pressure, while levels above +10 reflect strong upward momentum. A BBTrend rising from deep negative territory may be an early sign of a potential reversal or at least a slowdown of the downward trend.
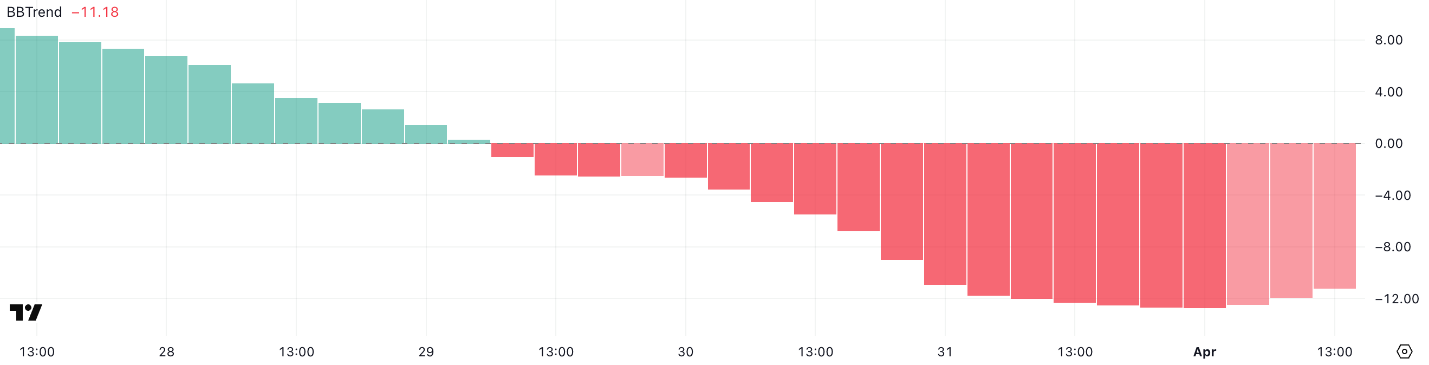 SOL BBTrend | Source: TradingViewThe BBTrend of SOL is still in a bearish zone but is showing signs of improvement, indicating that the market may be trying to stabilize after a period of strong sell-off.
However, the broader developments of the ecosystem complicate the technical picture. For example, Ethereum’s DEX trading volume recently surpassed Solana for the first time in 6 months.
Although BBTrend is showing a bearish signal suggesting potential recovery, Solana still needs stronger confirmation to consolidate the reversal trend. Until then, the optimistic sentiment must remain cautious, as the bears have not fully lost control.
Solana still has many challenges ahead
Solana’s EMA is signaling an impending Golden Cross. The Golden Cross occurs when the short-term moving average crosses above the long-term moving average. That is often taken as a bullish signal that could mark the beginning of a sustained uptrend.
If this pattern is confirmed and buying momentum continues, the price of Solana could rise to test the resistance level at 131 dollars.
A successful breakout above that level could open up higher upward momentum, with potential targets of $136 and even $147.
 SOL Price Analysis | Source: TradingViewHowever, the downside risk remains if buyers cannot maintain the recent upward momentum.
If SOL falls below the important support level at $124, this could trigger further selling pressure, pushing the price down to $120. In a worse-case scenario, if the downward momentum continues strongly, SOL may face deeper support around $112.
Disclaimer*: This article is for informational purposes only and is not investment advice. Investors should conduct thorough research before making decisions. We are not responsible for your investment decisions*
- Bitcoin (BTC) is experiencing significant volatility ahead of Trump’s ‘liberation day’ – What awaits ahead?
- Ethereum regains the number 1 position as the leading DEX chain since September, surpassing Solana.
- The Solana Policy Institute will lobby for SOL in the US
Minh Anh
@media only screen and (min-width: 0px) and (min-height: 0px) {
div[id^=“wrapper-sevio-d89f58f5-7b63-40be-98c0-6b1fd62584fb”] {
width:320px;
height: 100px;
}
}
@media only screen and (min-width: 728px) and (min-height: 0px) {
div[id^=“wrapper-sevio-d89f58f5-7b63-40be-98c0-6b1fd62584fb”] {
width: 728px;
height: 90px;
}
}
Disclaimer: The information on this page may come from third parties and does not represent the views or opinions of Gate. The content displayed on this page is for reference only and does not constitute any financial, investment, or legal advice. Gate does not guarantee the accuracy or completeness of the information and shall not be liable for any losses arising from the use of this information. Virtual asset investments carry high risks and are subject to significant price volatility. You may lose all of your invested principal. Please fully understand the relevant risks and make prudent decisions based on your own financial situation and risk tolerance. For details, please refer to
Disclaimer.
