Trade
Basic
Futures
Futures
Hundreds of contracts settled in USDT or BTC
TradFi
Gold
Trade global traditional assets with USDT in one place
Options
Hot
Trade European-style vanilla options
Unified Account
Maximize your capital efficiency
Demo Trading
Futures Kickoff
Get prepared for your futures trading
Futures Events
Participate in events to win generous rewards
Demo Trading
Use virtual funds to experience risk-free trading
Earn
Launch
CandyDrop
Collect candies to earn airdrops
Launchpool
Quick staking, earn potential new tokens
HODLer Airdrop
Hold GT and get massive airdrops for free
Launchpad
Be early to the next big token project
Alpha Points
Trade on-chain assets and enjoy airdrop rewards!
Futures Points
Earn futures points and claim airdrop rewards
Investment
Simple Earn
Earn interests with idle tokens
Auto-Invest
Auto-invest on a regular basis
Dual Investment
Buy low and sell high to take profits from price fluctuations
Soft Staking
Earn rewards with flexible staking
Crypto Loan
0 Fees
Pledge one crypto to borrow another
Lending Center
One-stop lending hub
VIP Wealth Hub
Customized wealth management empowers your assets growth
Private Wealth Management
Customized asset management to grow your digital assets
Quant Fund
Top asset management team helps you profit without hassle
Staking
Stake cryptos to earn in PoS products
Smart Leverage
New
No forced liquidation before maturity, worry-free leveraged gains
GUSD Minting
Use USDT/USDC to mint GUSD for treasury-level yields
More
KatyPaty
Crypto Market Volatility and Macro Data from U.S.
675
- Reward
- 1
- 1
- Repost
- Share
GateUser-1dcec337 :
:
2026 GOGOGO 👊If you had a $10M net worth, would you spend $3M on a Bugatti Chiron?

- Reward
- 2
- Comment
- Repost
- Share
$ASTROPUP
AstroPuppy
Created By@GateUser-96581ae4
Listing Progress
0.00%
MC:
$0.1
More Tokens
JUST IN: ARK INVEST BUYS THE "DIP", Cathie Wood's firm has reinforced its bet on the crypto sector by acquiring $4 million in Coinbase shares (COIN) and $12 million in Robinhood (HOOD).

- Reward
- 2
- Comment
- Repost
- Share
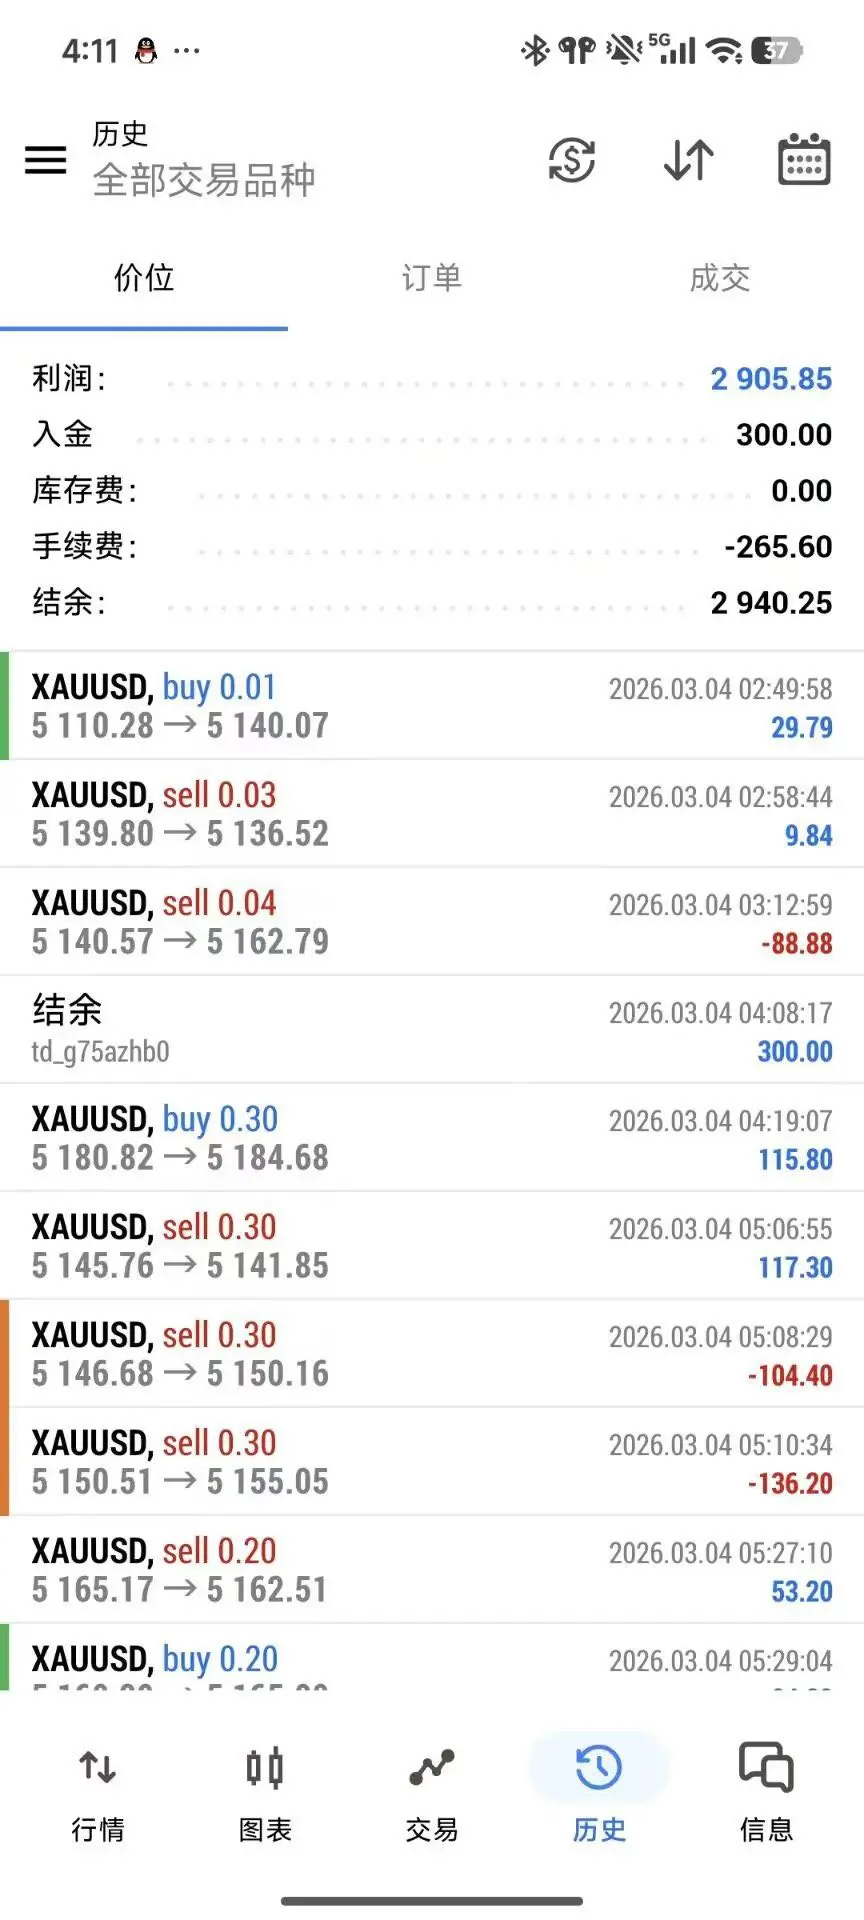
Go from 300 to 3000 in one day—that's about finding the right people and doing the right things.
If your thinking is unclear and your direction is confused, just go back to the vegetable garden and work steadily. #黄金
View OriginalIf your thinking is unclear and your direction is confused, just go back to the vegetable garden and work steadily. #黄金

- Reward
- like
- Comment
- Repost
- Share
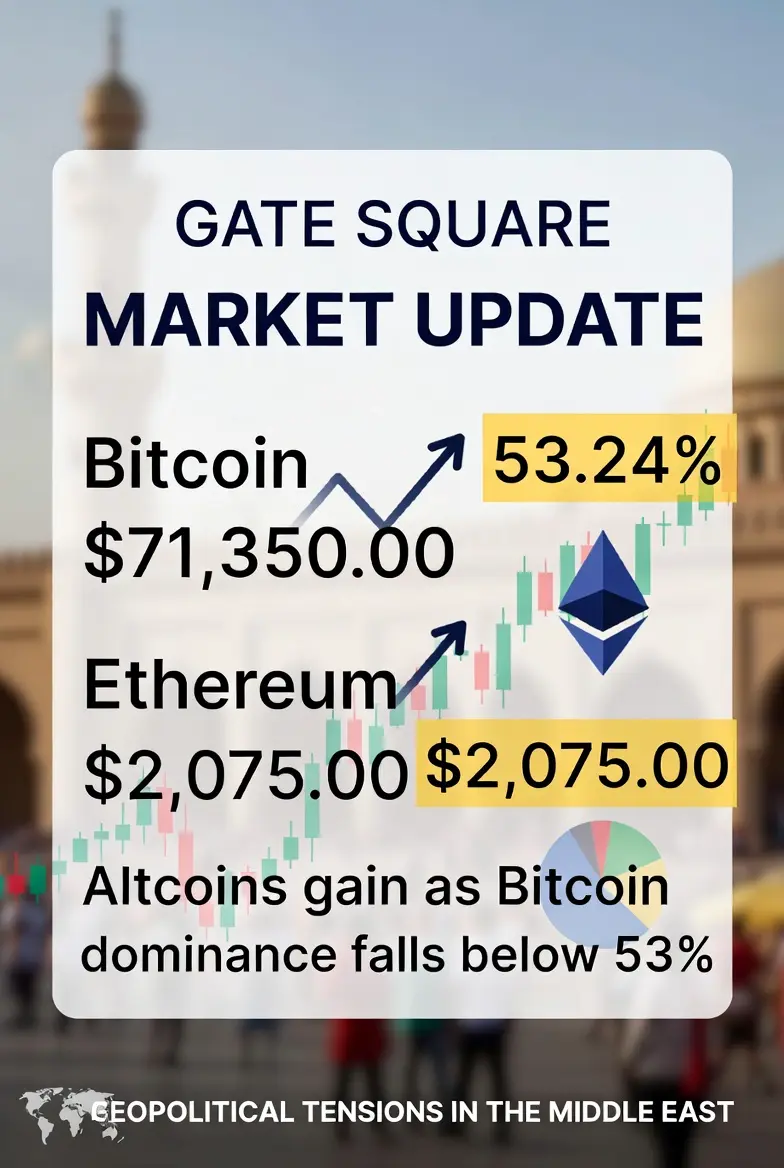
#加密市场上涨
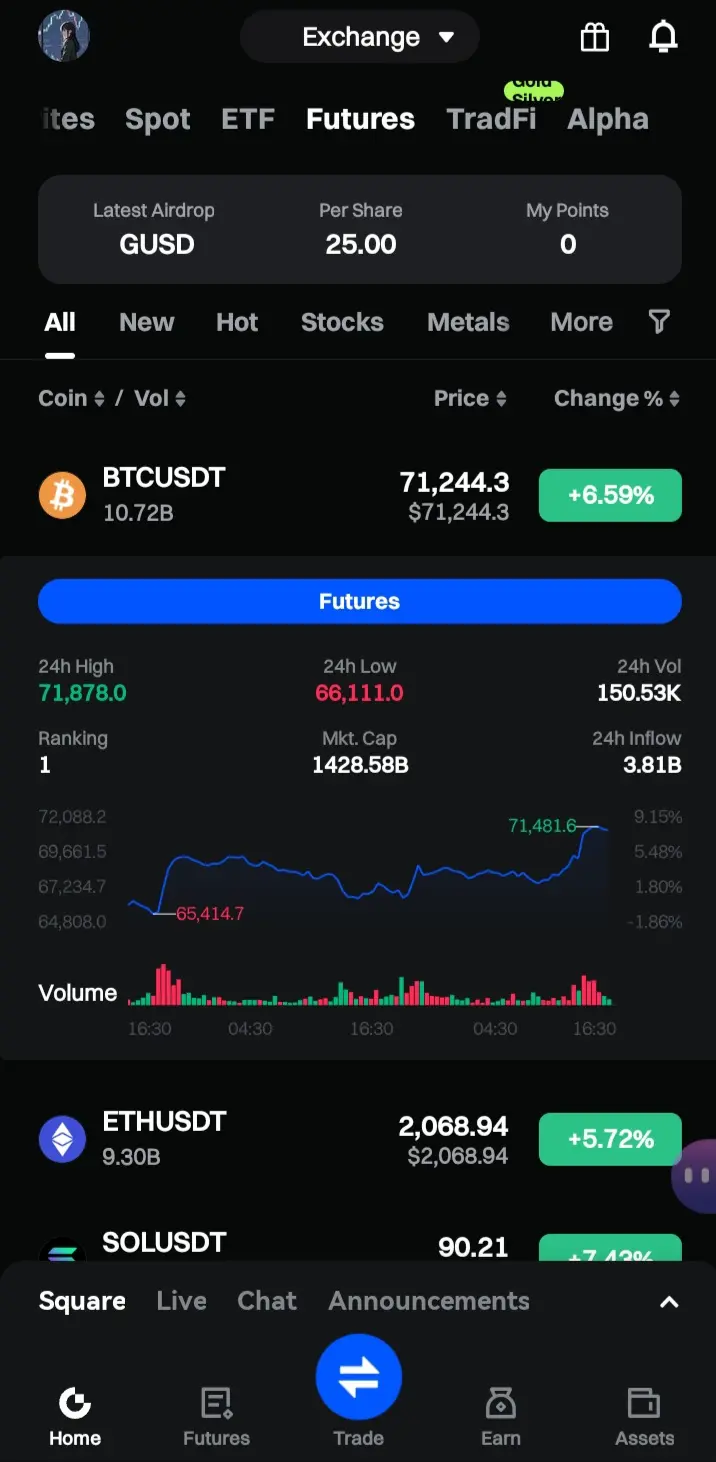
1. Market Surge – Bitcoin Leads the Charge
Bitcoin has surged to $71,350–$71,400, representing a 7.2–7.5% gain in the last 24 hours. Intraday highs even pushed toward $71,800+, marking a strong recovery from recent consolidation near $67k–$68k. The move is fueled by aggressive retail FOMO, institutional accumulation, and renewed market confidence despite ongoing geopolitical instability in the Middle East, including tensions involving Iran, Israel, and regional allies.
Why the market hasn’t collapsed amid escalating tensions:
Digital gold narrative strengthening: BTC increasingly acts

- Reward
- 7
- 5
- Repost
- Share
Thynk :
:
thanks for great information and perfectView More
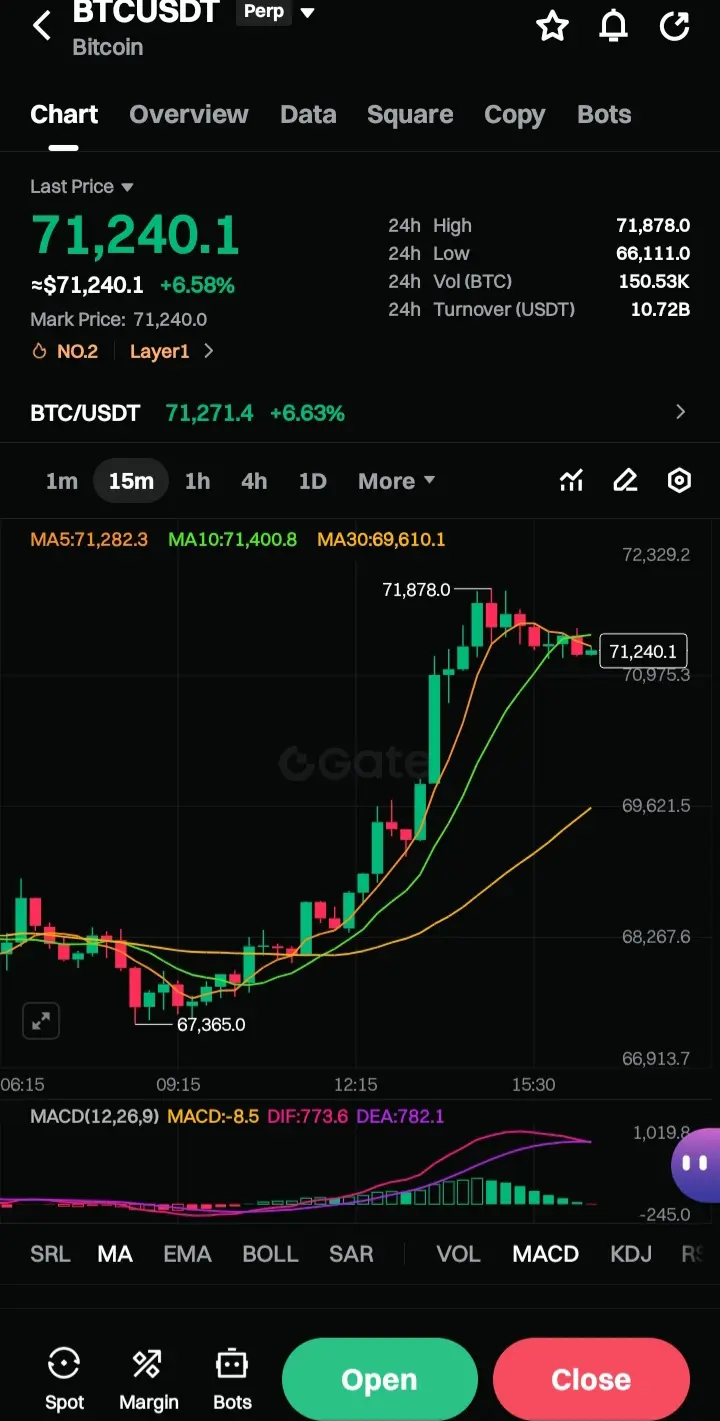
BTC/USDT Chart Analysis (15m timeframe)
$BTC #BitcoinBouncesBack
Current Price Action
Price: $71,240.1 (+6.58% on the day)
24h Range: $66,111 – $71,878
Massive intraday rally from low of $67,365 around 12:00–12:15
Moving Averages
| MA | Value | Signal |
|----|-------|--------|
| MA5 | 71,282.3 | Price just below — slight resistance |
| MA10 | 71,400.8 | Near-term resistance zone |
| MA30 | 69,610.1 | Well below — strongly bullish gap |
Price is consolidating just under MA5/MA10, very similar pattern to SOL — post-rally digestion phase.
MACD (12,26,9)
MACD: -8.5 | DIF: 773.6 | DEA: 782.1
MAC
BTC5.05%
- Reward
- 1
- Comment
- Repost
- Share
Wave after wave, those who are willing to learn, listen, and follow through, and don't mess around on their own, will gradually be able to achieve stable profits. #黄金
View Original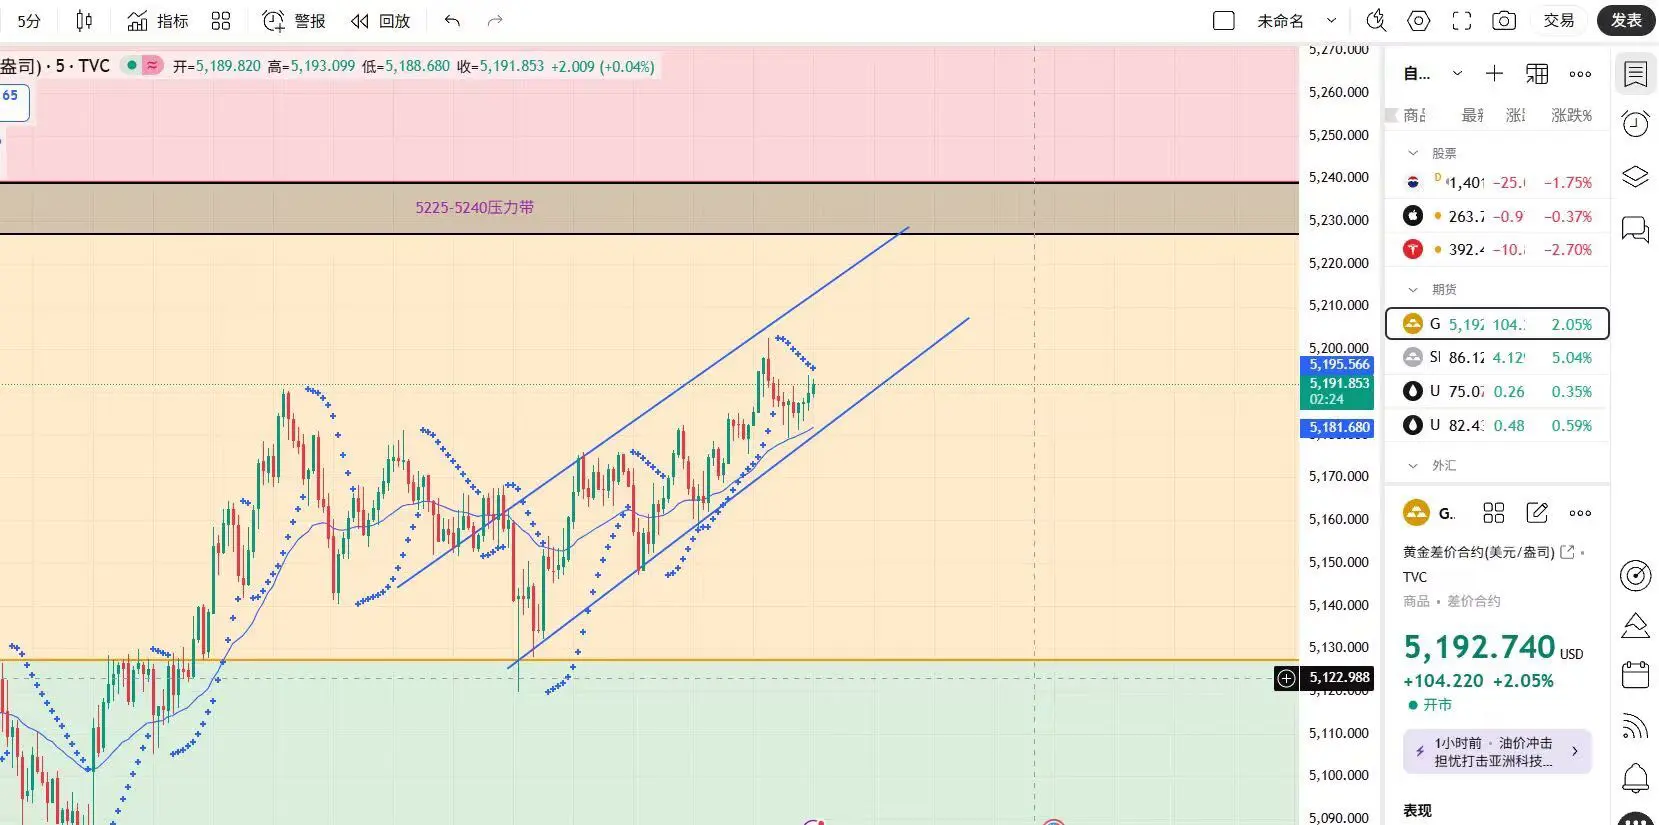


- Reward
- like
- Comment
- Repost
- Share
OpenClaw: An AI Tool Reshaping Content Creation in the Crypto World
Recently, in both the crypto and AI circles, one name has been mentioned repeatedly—OpenClaw.
Many first encountered it when they saw someone automatically generating tweets in Telegram groups; some used it to batch produce project descriptions; others directly regarded it as a "24/7 community operation assistant." In just a few months, OpenClaw has evolved from a simple tool into a "way of working."
This is not an exaggeration but a real transformation happening now.
1. What is the essence of OpenClaw?
OpenClaw is not just a
BTC5.05%

- Reward
- 2
- Comment
- Repost
- Share
#CelebratingNewYearOnGateSquare #我在Gate广场过新年
Welcome 2026 with Power & Prosperity on Gate.io
The Year of the Horse has officially arrived, and Gate Square is celebrating in full speed mode with a $50,000 Spring Festival prize pool designed to reward creativity, positivity, and community spirit.
This year’s celebration blends festive energy with real earning opportunities, turning every original post into a potential reward gateway.
🧧 Red Packet Rain – Community Powered Rewards
The upgraded Red Packet Rain system ensures:
🎁 100% guaranteed reward for first-time participants
🪙 Up to 28 GT for
GT0.28%

- Reward
- 3
- Comment
- Repost
- Share
#GlobalRate-CutExpectationsCoolOff
March 4, 2026 — Global financial markets are entering a phase of recalibration as expectations for imminent rate cuts around the world begin to cool off. After a prolonged period of aggressive monetary easing hopes fueled by central bank rhetoric, slowing economic data, and mounting geopolitical pressures investors are confronting a reality that rate reduction cycles may be narrower and more gradual than previously anticipated. Over the past several months, market participants had been pricing in multiple interest rate cuts across major economies, including
March 4, 2026 — Global financial markets are entering a phase of recalibration as expectations for imminent rate cuts around the world begin to cool off. After a prolonged period of aggressive monetary easing hopes fueled by central bank rhetoric, slowing economic data, and mounting geopolitical pressures investors are confronting a reality that rate reduction cycles may be narrower and more gradual than previously anticipated. Over the past several months, market participants had been pricing in multiple interest rate cuts across major economies, including


- Reward
- 2
- Comment
- Repost
- Share
DMY
Digital Money
Created By@GateUser-928d764b
Listing Progress
0.00%
MC:
$2.39K
More Tokens
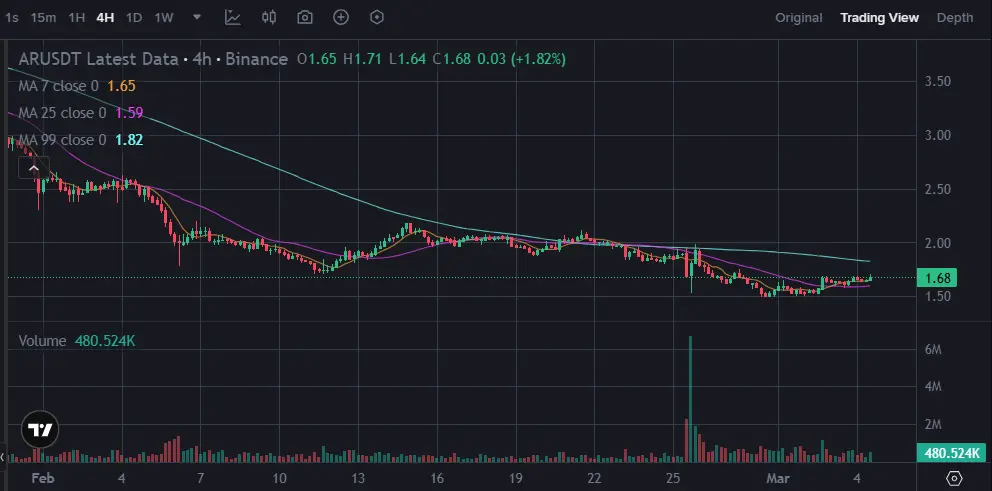
$AR $AR USDT is attempting a recovery after a prolonged downtrend. Price bounced from the 1.50–1.55 support zone and reclaimed MA7 & MA25, showing improving short-term momentum. However, it is still trading below MA99 near 1.82, which remains key resistance. A break above 1.75–1.80 could accelerate upside.
Entry Zone: 1.60 – 1.68
TP1: 1.75
TP2: 1.90
TP3: 2.10
Stop Loss: 1.52
Entry Zone: 1.60 – 1.68
TP1: 1.75
TP2: 1.90
TP3: 2.10
Stop Loss: 1.52
AR2.28%
- Reward
- like
- Comment
- Repost
- Share
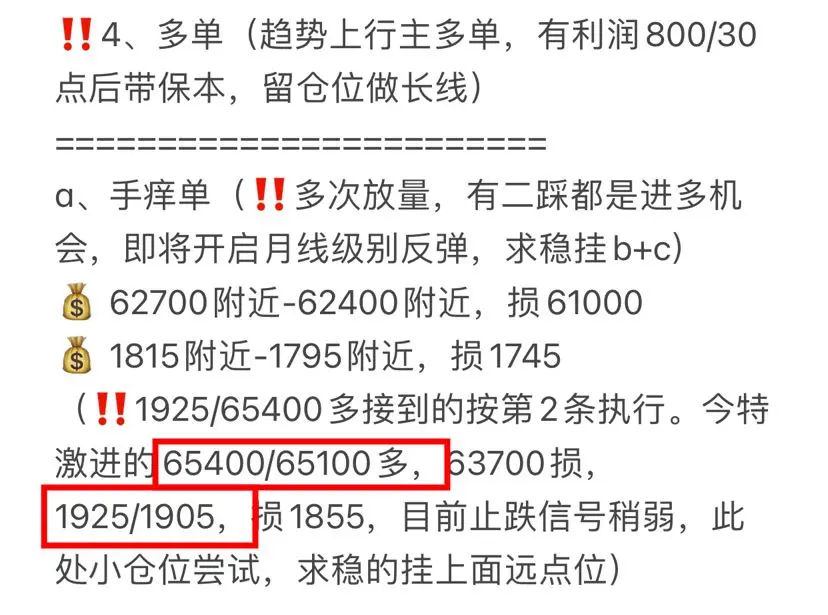
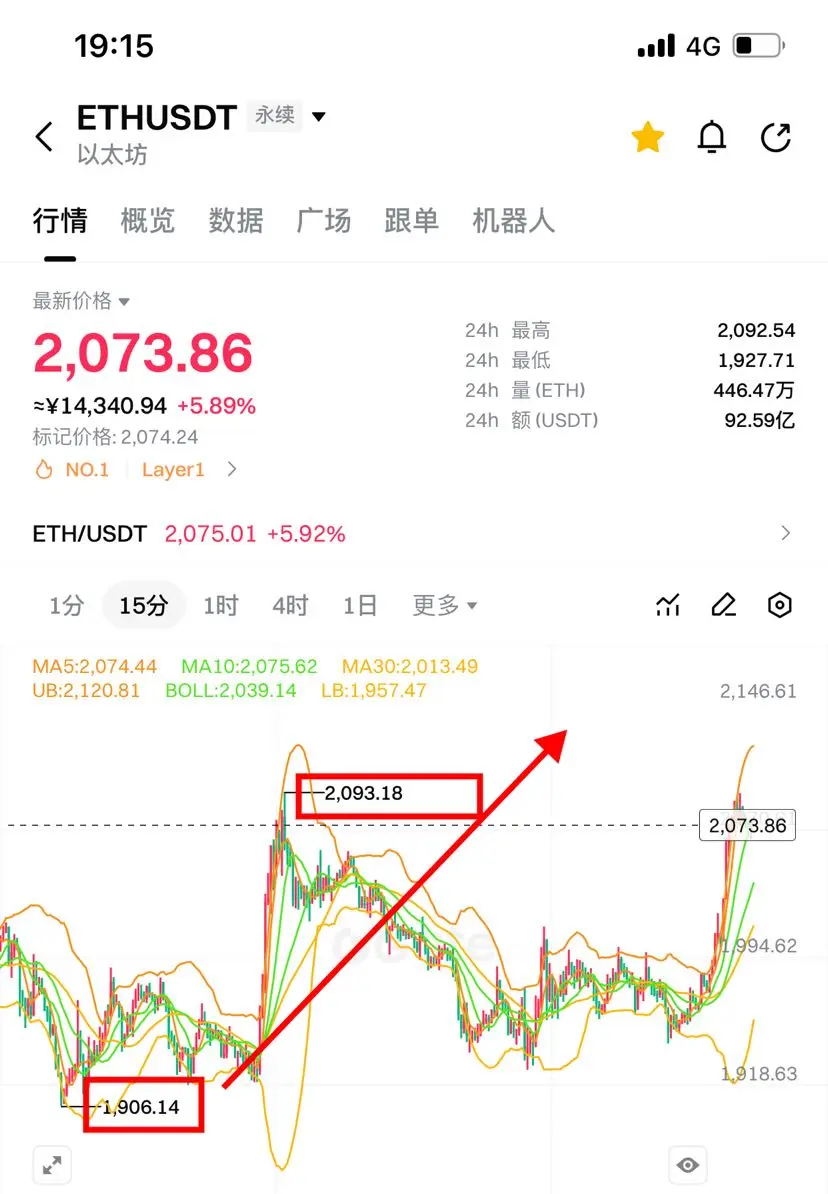
🌹Guan Peace Wheel family, giving U‼️ Unknowingly, this is the 4th year of subscription. The Spring Festival half-price 5gt offer ends tonight and will revert to the original price of 10gt‼️ Friends who subscribe are not fools; if you're not making money, I dare you to 😄 click on 👇 or copy it to the web page to subscribe:
https://www.gate.com/zh/profile/When will the autumn rain end
————————————————
🌹Last Wednesday 62800/1800+70000/2150 pressure, then eat meat
🌹Friday 70000/2150, empty 62950/1835, eat meat
————————————————
🌹Saturday reverse hand 63000/1840, more 68200/2050, eat meat
🌹Yes
View Originalhttps://www.gate.com/zh/profile/When will the autumn rain end
————————————————
🌹Last Wednesday 62800/1800+70000/2150 pressure, then eat meat
🌹Friday 70000/2150, empty 62950/1835, eat meat
————————————————
🌹Saturday reverse hand 63000/1840, more 68200/2050, eat meat
🌹Yes

- Reward
- 11
- 9
- Repost
- Share
KeepUpWithTheRhythmOfTheTimes :
:
2026 Go Go Go 👊View More
🌟Gate Live Bonus Task -BountyDrop(IDOS)
758
- Reward
- like
- Comment
- Repost
- Share
My ex-girlfriend and Xue Zhiqian's ex-girlfriend, they broke up with their ex-boyfriends 10 years ago, but their ex-girlfriends still can't forget about them.
They keep exposing them on social media, criticizing them, why is that?
If they never succeeded with Xue Zhiqian, if they are just poor guys, would their ex-girlfriends still miss them so much 10 years after the breakup?
Would they still feel so unresolved?
Would they still hate them so much?
So, the same person, why does a man with money and a man without money evoke such different reactions from their ex-girlfriends?
Can anyone tell me
View OriginalThey keep exposing them on social media, criticizing them, why is that?
If they never succeeded with Xue Zhiqian, if they are just poor guys, would their ex-girlfriends still miss them so much 10 years after the breakup?
Would they still feel so unresolved?
Would they still hate them so much?
So, the same person, why does a man with money and a man without money evoke such different reactions from their ex-girlfriends?
Can anyone tell me

- Reward
- 1
- Comment
- Repost
- Share
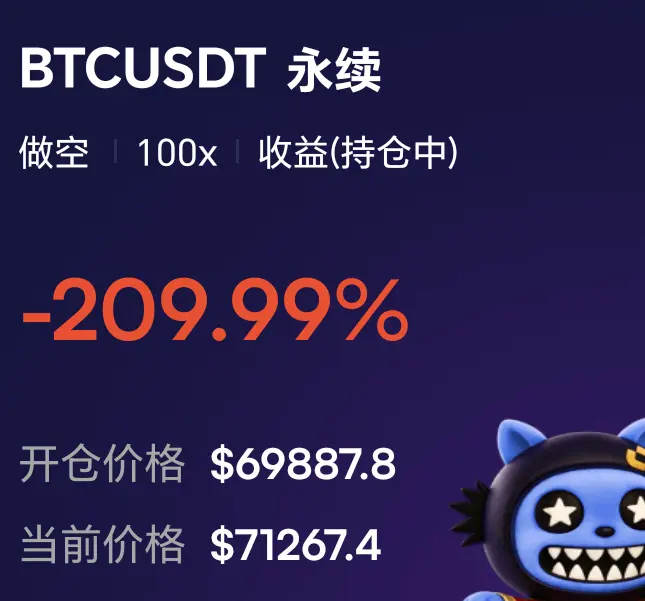
Fell below 67,500 and made 1,000 points but didn't sell
Now it's the other way around, trapped for nearly 3,000 points
But it's okay, I can stay steady
Just in time for me to add to my position
Added 2.5 more Bitcoin
Currently averaging around 69,900
No time to wait, what are you waiting for now?
#BTC
View OriginalNow it's the other way around, trapped for nearly 3,000 points
But it's okay, I can stay steady
Just in time for me to add to my position
Added 2.5 more Bitcoin
Currently averaging around 69,900
No time to wait, what are you waiting for now?
#BTC
- Reward
- 2
- Comment
- Repost
- Share
#VisatoLaunchCryptoCreditCard
March 4, 2026 — The financial and crypto communities are buzzing today as Visa announces the launch of its long-awaited crypto credit card, ushering in a potentially transformative moment for digital asset adoption and mainstream payment infrastructure. This development comes at a time when both institutional and retail interest in cryptocurrency payments continues to accelerate, yet widespread utility has remained a challenge due to volatility, regulatory uncertainty, and limited real-world integrations. With Visa’s deep global footprint, decades of payment-netw
March 4, 2026 — The financial and crypto communities are buzzing today as Visa announces the launch of its long-awaited crypto credit card, ushering in a potentially transformative moment for digital asset adoption and mainstream payment infrastructure. This development comes at a time when both institutional and retail interest in cryptocurrency payments continues to accelerate, yet widespread utility has remained a challenge due to volatility, regulatory uncertainty, and limited real-world integrations. With Visa’s deep global footprint, decades of payment-netw

- Reward
- 2
- Comment
- Repost
- Share
First order of the afternoon, 73-53 reduce position and pull protection
View Original


- Reward
- 2
- Comment
- Repost
- Share
- Reward
- 2
- Comment
- Repost
- Share
Load More
Join 40M users in our growing community
⚡️ Join 40M users in the crypto craze discussion
💬 Engage with your favorite top creators
👍 See what interests you
Trending Topics
View More309.13K Popularity
119.6K Popularity
179.04K Popularity
14.44K Popularity
414.87K Popularity
Hot Gate Fun
View More- MC:$2.41KHolders:00.00%
- MC:$0.1Holders:10.00%
- MC:$2.45KHolders:20.02%
- MC:$0.1Holders:10.00%
- MC:$0.1Holders:10.00%
News
View MoreU.S. military conducts strikes against Iranian warship
3 m
Institution: The Federal Reserve still has room to cut interest rates in the second half of the year, and the recent rebound of the US dollar may be short-lived.
14 m
Jiuzi Holdings reaches a strategic agreement to acquire 10,000 Bitcoins transfer from a certain strategic investor
15 m
Nasdaq 100 Index futures reverse gains, turn to decline
17 m
RIVER increased by 443.20% after launching Alpha, current price is 93.375 USDT
20 m
Pin