Trade
Trading Type
Spot
Trade crypto freely
Alpha
Points
Get promising tokens in streamlined on-chain trading
Pre-Market
Trade new tokens before they are officially listed
Margin
Magnify your profit with leverage
Convert & Block Trading
0 Fees
Trade any size with no fees and no slippage
Leveraged Tokens
Get exposure to leveraged positions simply
Futures
Futures
Hundreds of contracts settled in USDT or BTC
Options
HOT
Trade European-style vanilla options
Unified Account
Maximize your capital efficiency
Demo Trading
Futures Kickoff
Get prepared for your futures trading
Futures Events
Participate in events to win generous rewards
Demo Trading
Use virtual funds to experience risk-free trading
Earn
Launch
CandyDrop
Collect candies to earn airdrops
Launchpool
Quick staking, earn potential new tokens
HODLer Airdrop
Hold GT and get massive airdrops for free
Launchpad
Be early to the next big token project
Alpha Points
NEW
Trade on-chain assets and enjoy airdrop rewards!
Futures Points
NEW
Earn futures points and claim airdrop rewards
Investment
Simple Earn
Earn interests with idle tokens
Auto-Invest
Auto-invest on a regular basis
Dual Investment
Buy low and sell high to take profits from price fluctuations
Soft Staking
Earn rewards with flexible staking
Crypto Loan
0 Fees
Pledge one crypto to borrow another
Lending Center
One-stop lending hub
VIP Wealth Hub
Customized wealth management empowers your assets growth
Private Wealth Management
Customized asset management to grow your digital assets
Quant Fund
Top asset management team helps you profit without hassle
Staking
Stake cryptos to earn in PoS products
BTC Staking
HOT
Stake BTC and earn 10% APR
GUSD Minting
Use USDT/USDC to mint GUSD for treasury-level yields
More
Trending Topics
View More88.85K Popularity
39.7K Popularity
21.1K Popularity
6.85K Popularity
4.13K Popularity
Hot Gate Fun
View More- MC:$3.54KHolders:10.00%
- MC:$3.6KHolders:20.15%
- MC:$3.59KHolders:20.00%
- MC:$3.59KHolders:20.00%
- MC:$3.59KHolders:20.00%
Pin
🎉 Share Your 2025 Year-End Summary & Win $10,000 Sharing Rewards!
Reflect on your year with Gate and share your report on Square for a chance to win $10,000!
👇 How to Join:
1️⃣ Click to check your Year-End Summary: https://www.gate.com/competition/your-year-in-review-2025
2️⃣ After viewing, share it on social media or Gate Square using the "Share" button
3️⃣ Invite friends to like, comment, and share. More interactions, higher chances of winning!
🎁 Generous Prizes:
1️⃣ Daily Lucky Winner: 1 winner per day gets $30 GT, a branded hoodie, and a Gate × Red Bull tumbler
2️⃣ Lucky Share Draw: 10🔥 Gate Square Event | #PostToWinLaunchpadKDK 🔥
KDK | The latest Gate Launchpad spotlight token
Before: stake USDT to join
Now 👉 just post for a chance to win KDK!
🎁 Gate Square exclusive: 2,000 KDK total rewards up for grabs
🚀 Launchpad star project — big potential ahead 👀
📅 Event Duration
Dec 19, 04:00 – Dec 30, 16:00 (UTC)
📌 How to Join
Post on Gate Square (text, images, analysis, or opinions)
Content should relate to KDK price predictions at launch, project insights, or your understanding of the Gate Launchpad mechanism
Add one hashtag: #发帖赢Launchpad新币KDK 或 #PostToWinLaunchpadKDK
�🎨 Gate AI Creation Contest | One Sentence, Draw Your 2026
On Gate Square, anyone can be a visual creator — truly zero barriers to entry.
With just one sentence, generate an image and bring your vision of 2026 to life.
Create and post your work using Gate Square AI Creation for a chance to win the Gate Year of the Horse New Year Gift Box.
📅 Duration
Dec 17, 2025, 10:00 – Jan 3, 2026, 18:00 UTC
🎯 How to Join
1. Go to Gate Square → Create Post → AI Creation
2. Enter one sentence to generate your image
3. Post with #GateAICreation
🏆 Rewards
5 winners: Gate Year of the Horse New Year
Three charts to analyze the logic behind Bitcoin's bull market
作者:Omkar Godbole, CoinDesk
编译:Felix, PANews
Bitcoin has risen by 120% since the beginning of the year, and most analysts widely predict that it will rise further in the near term. They noted that the U.S. Securities and Exchange Commission (SEC) is expected to approve one or more Bitcoin spot ETFs soon, while the Bitcoin halving in April next year is imminent.
Changes in the market economic environment have also supported the bullish view of Bitcoin. The following three charts show a positive shift in the macroeconomic factors that led to last year’s price crash.
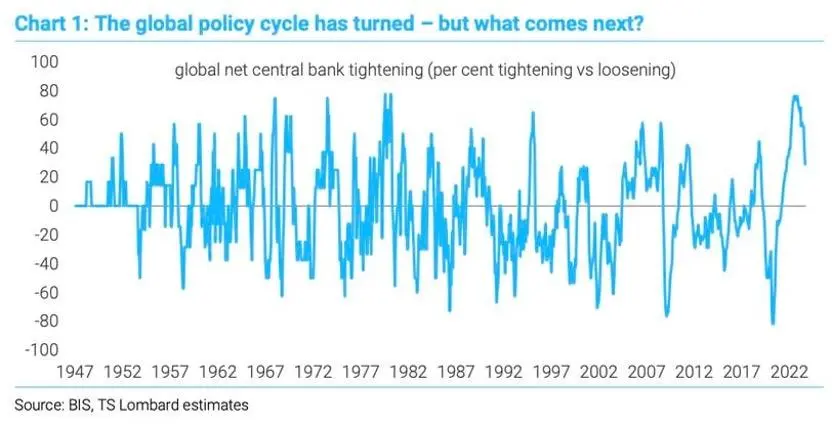
A turning point in the global tightening cycle? could bring more money to the crypto market
* *
*
*The global tightening cycle that shook financial assets, including cryptocurrencies, last year has reached its peak (BIS, TS Lombard) *
A chart by macroeconomic forecasting consultancy TS Lombard shows how central bank tightening versus accommodative monetary policy since 1947. A positive value indicates a preference for contractionary monetary policy, while a negative value indicates a preference for accommodative monetary policy.
Accommodative policy involves increasing market liquidity through interest rate cuts and other measures to release more money into the financial system, as it did in the 18 months following the coronavirus outbreak in March 2020, while tightening monetary policy involves absorbing market liquidity through interest rate hikes and other tools to curb inflation.
Recently, this trend has declined, suggesting that the global tightening cycle of financial markets, including cryptocurrency, has peaked last year, and now the market is increasingly inclined towards loose liquidity.
And as global inflation slows, central banks have more room to start slowing down the tightening of monetary policy, which could lead to more money flowing into the crypto market. Bitcoin is known to be extremely sensitive to changes in global liquidity conditions, and when there is more liquidity in the market, the price of Bitcoin tends to rise.
The U.S. financial situation has eased somewhat
Wall Street giant Goldman Sachs’ Index of Financial Conditions (FCI) since January, according to the chart below, has fallen to just under 100 from a year-to-date high of 100.74 a few weeks ago, offsetting all the tightening seen in September and October.
Variables included in the FCI include short-term interest rates, long-term interest rates, trade-weighted exchange rates, credit spread indices, and the ratio of stock prices to 10-year average earnings per share. Every 1% decline (rise) in the index drives a positive (negative) change in GDP of 1% over the next three to four quarters.
The decline in the index is contrary to the Fed’s long-term interest rate hike stance and hints at the resilience of the US economy in the future, which is a positive sign for risk assets, including cryptocurrencies. And most of Bitcoin’s gains so far this year have occurred during the US trading session.
The FCI has fallen to just below 100, reversing the entire tightening policy since September and October (Goldman Sachs)
According to Fed analysts, financial conditions are “a combination of asset prices and interest rates” that change depending on the health of the economy and monetary policy, and can also affect the economy itself.
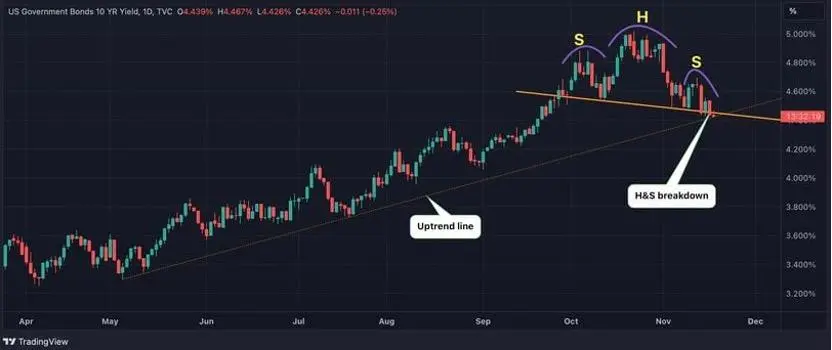
The 10-year Treasury yield is trending downward, and there are positive signals for risk assets
The decline in the yield on the US 10-year Treasury bond, the so-called risk-free rate, is also another positive sign for the rise of bitcoin. The yield on the 10-year Treasury note has fallen 50 basis points to 4.43% since the Treasury announced a slowdown in bond purchases earlier this month. Typically, this decline tends to prompt investors to turn to other assets such as stocks and cryptocurrencies in search of higher returns.
At the same time, judging by the bearish head and shoulders pattern on the daily chart of the 10-year Treasury note, its yield could fall further.
In a note to clients this week, EFG’s research team said, “The 10-year Treasury yield hit a lower high (as expected) and fell below the head and shoulders top.” The pattern’s gain target is around 3.93%, but the current level (uptrend) and 4.33% (breakout point) are also potential support levels. ”
* *
*
U.S. 10-year Treasury yield daily chart (TradingView/CoinDesk)
Potential Risks
However, a reversal in tighter financial conditions hinted at by the Goldman Sachs FCI index could bring a more hawkish tone to the Fed’s rhetoric, forcing markets to reconsider the possibility of another rate hike in the coming months. This could slow the pace of Bitcoin’s rally.
In addition, bulls should also pay attention to the root causes of risk asset price volatility such as Japan’s exit from ultra-loose monetary policy, geopolitical issues, US commercial real estate concerns, and potential inflation increases.
Related Reading: Nansen Founder: 11 Bull Market Catalysts & 6 Bullish Trends