Trade
Basic
Futures
Futures
Hundreds of contracts settled in USDT or BTC
TradFi
Gold
Trade global traditional assets with USDT in one place
Options
Hot
Trade European-style vanilla options
Unified Account
Maximize your capital efficiency
Demo Trading
Futures Kickoff
Get prepared for your futures trading
Futures Events
Participate in events to win generous rewards
Demo Trading
Use virtual funds to experience risk-free trading
Earn
Launch
CandyDrop
Collect candies to earn airdrops
Launchpool
Quick staking, earn potential new tokens
HODLer Airdrop
Hold GT and get massive airdrops for free
Launchpad
Be early to the next big token project
Alpha Points
Trade on-chain assets and enjoy airdrop rewards!
Futures Points
Earn futures points and claim airdrop rewards
Investment
Simple Earn
Earn interests with idle tokens
Auto-Invest
Auto-invest on a regular basis
Dual Investment
Buy low and sell high to take profits from price fluctuations
Soft Staking
Earn rewards with flexible staking
Crypto Loan
0 Fees
Pledge one crypto to borrow another
Lending Center
One-stop lending hub
VIP Wealth Hub
Customized wealth management empowers your assets growth
Private Wealth Management
Customized asset management to grow your digital assets
Quant Fund
Top asset management team helps you profit without hassle
Staking
Stake cryptos to earn in PoS products
Smart Leverage
New
No forced liquidation before maturity, worry-free leveraged gains
GUSD Minting
Use USDT/USDC to mint GUSD for treasury-level yields
More
Zhang Yaoxi: Concerns over conflicts and inflation coexist, with gold prices expected to fluctuate upward in a pre-shock manner
Zhang Yaoxi: Concerns over Conflict and Inflation Coexist, Gold Prices Preliminarily Oscillate and Rise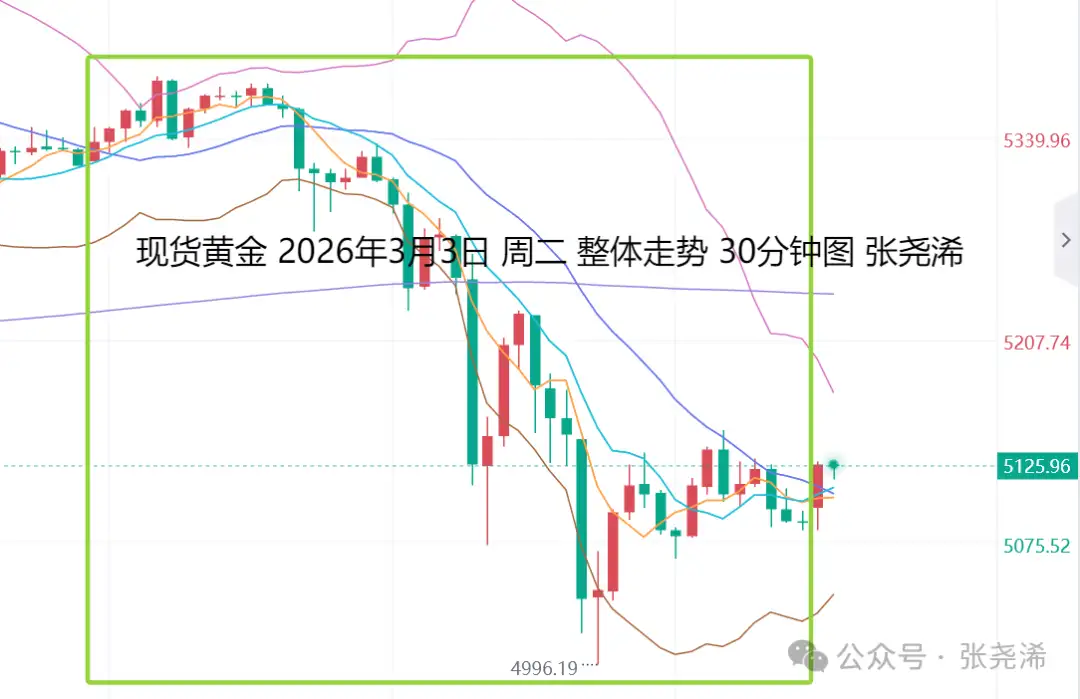
On the previous trading day, Tuesday (March 3): International gold prices sharply declined and closed lower, weighed down by market worries that Middle East conflicts could become prolonged and exacerbate inflation concerns, which boosted the US dollar significantly. This also delayed the market’s expected Fed rate cuts from July to September, causing gold prices to plunge and recover the gains from the past two weeks, aligning with the intraday bearish divergence outlook.
However, after the decline, prices retested the previous upward trend channel support, presenting another bullish entry opportunity. Under bullish support buying and ongoing geopolitical risks, coupled with Trump’s statement that after the 15% tariff deadline, tariffs on certain countries will be increased, the fundamentals remain positive. Therefore, the future trend is expected to be oscillating upward.
In terms of impact, gold opened in Asia at $5,324.24 per ounce, initially strengthened to a daily high of $5,379.30, then faced resistance and fell back, continuing to decline during European and US trading hours, reaching a daily low of $4,995.72 at 11 PM US time. It eventually rebounded and closed at $5,088.54, with a daily range of $383.58, down $235.7 or 4.43%.
Looking ahead to Wednesday (March 4): International gold continued its overnight rebound at the open, showing strength supported by robust bullish buying, while the US dollar index also continued its overnight retreat, easing bullish momentum.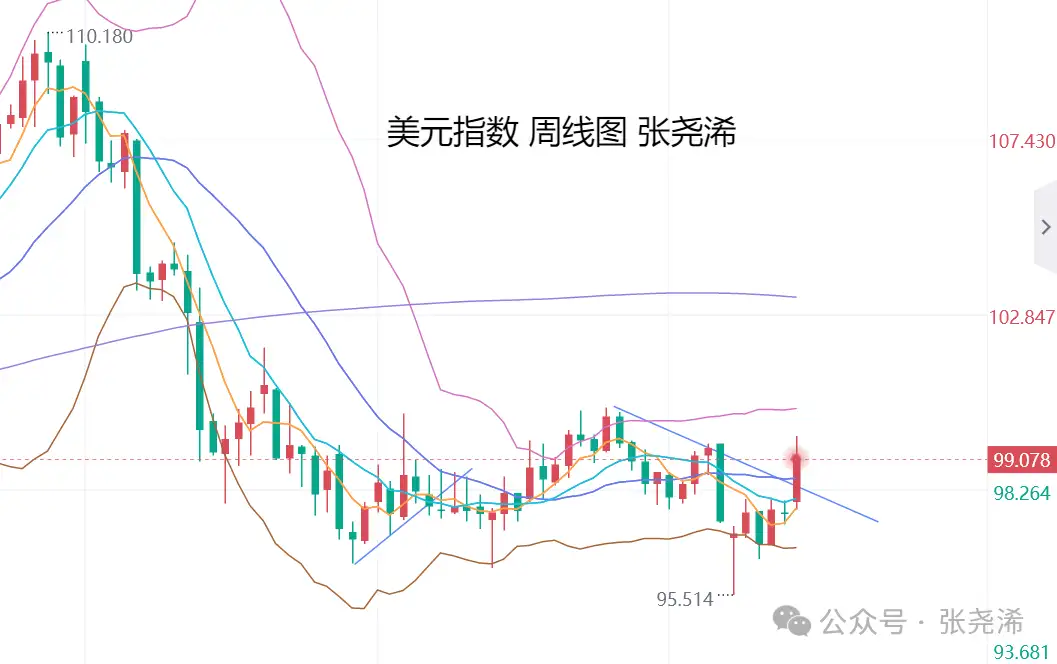
In the short term, the US dollar index remains below key resistance levels. Before breaking above the 200-week moving average, the outlook remains relatively weak, exerting limited pressure on gold prices. Technically and fundamentally, gold still maintains a bullish advantage. Therefore, the trading strategy remains small dips to buy, large dips to buy more, and avoiding large drops while accumulating on declines—an approach of “more on dips, less on rises.”
Today’s focus will be on US February ADP employment data (in ten-thousands), US February S&P Global Services PMI final, and US February ISM Non-Manufacturing PMI. Market expectations lean towards a bearish impact on gold prices, but since Thursday and Friday’s employment data are expected to be positive, intra-day downside pressure is limited. The strategy will be short-term bearish and bullish.
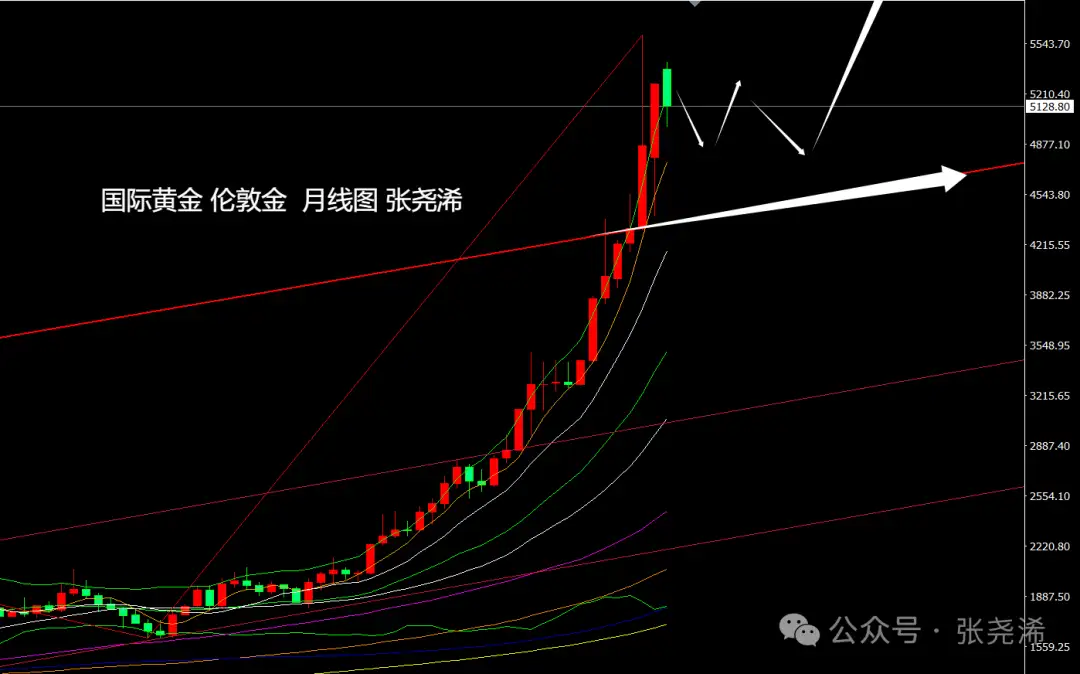
On the technical side, at the monthly level, gold in February continued the bearish reversal from January’s inverted hammer, but after testing the upward trend resistance turned support that was broken earlier this year, it rebounded, negating the top-down bearish outlook. Although it retreated slightly this month, it remains above the 5-month moving average, still within a bullish space with a good outlook. The future trend is expected to stay above the upward trend line and potentially reach new highs.
At the weekly chart level, gold faced resistance and retreated this week, again testing support below the 5-week moving average, but overall remains in an upward trend. If further declines occur, support levels include the 10-week moving average and the middle Bollinger Band, which also present bullish entry opportunities.
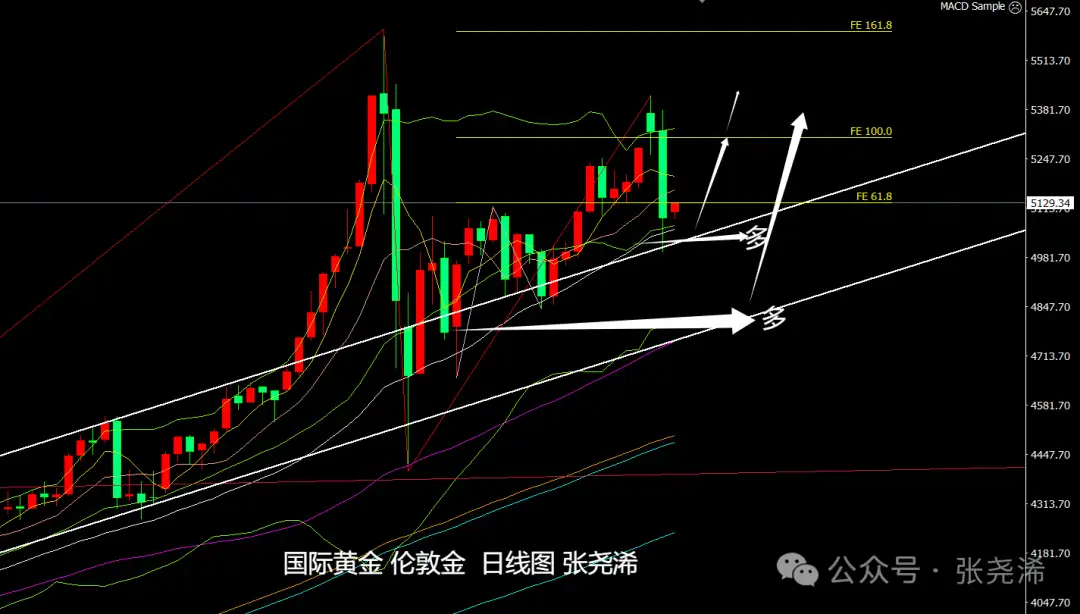
On the daily chart, gold has sharply retreated to the middle Bollinger Band and the upward trend channel support. Although the ZZ indicator does not show a bottoming reversal, it still offers a bullish buying opportunity. The 60-day moving average support is another chance to position for medium- to long-term gains.
Gold: Support levels around $5,060 or $4,970; resistance levels near $5,180 or $5,260.
Silver: Support levels around $80.00 or $77.60; resistance levels near $86.70 or $89.30.
Note:
Gold TD = (International gold price × exchange rate) / 31.1035
A $1 fluctuation in international gold prices roughly causes a $0.25 change in Gold TD (theoretically).
US futures gold price = London spot price × (1 + gold swap rate × futures expiry days / 365)
Follow me to make your gold trading ideas clearer!
Review historical cause and effect, interpret the current environment, and forecast future trends. Adhere to bold predictions and cautious trading principles. – Zhang Yaoxi
The above opinions and analyses are solely the author’s personal views, for reference only, not trading advice. Trade at your own risk.
You decide your own money.