


#ETHLongShortBattle
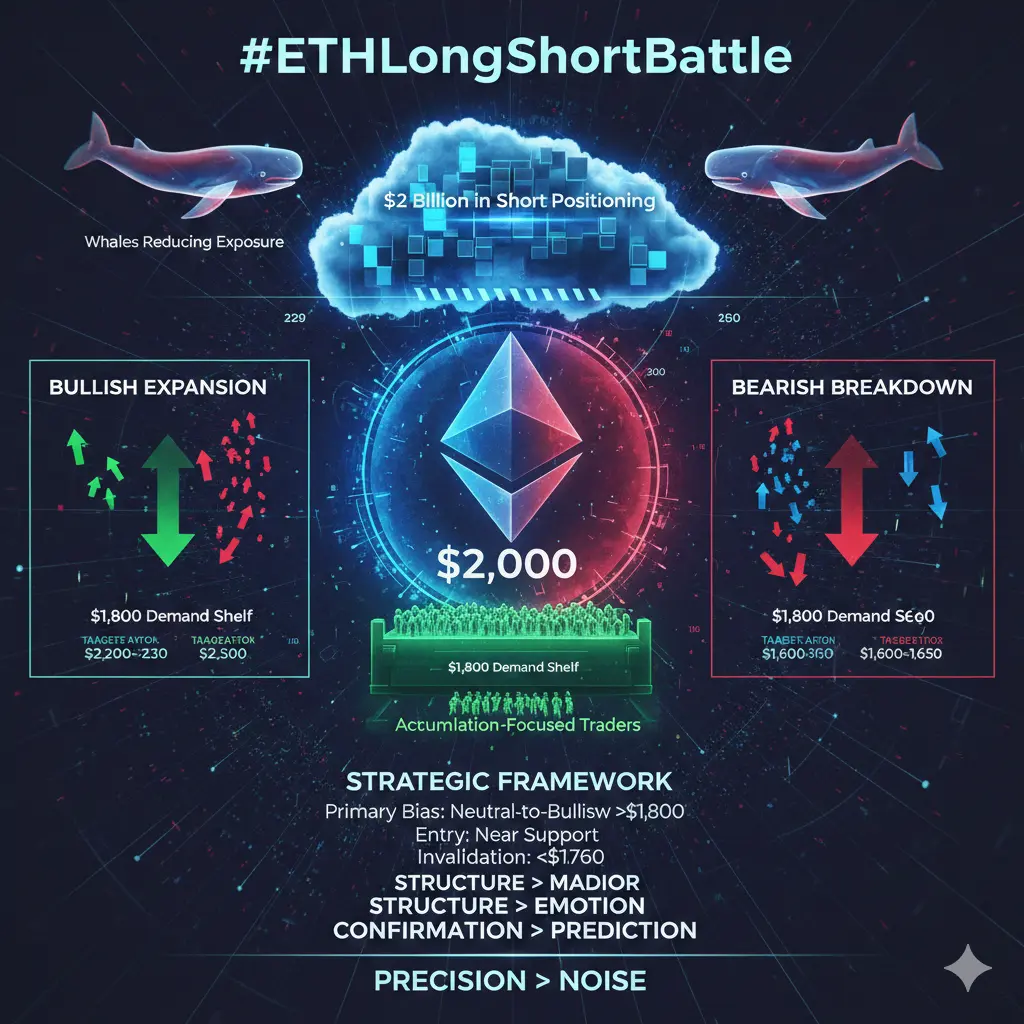
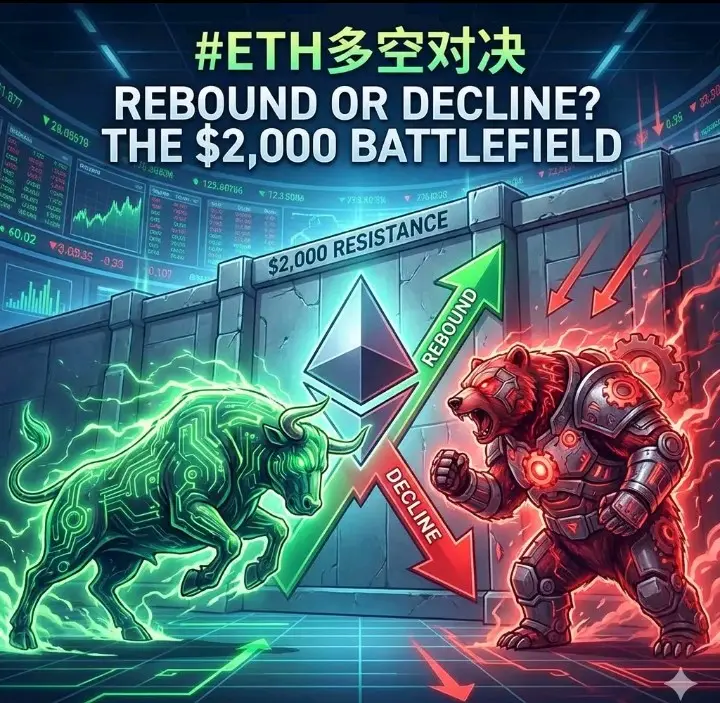
Ethereum is locked in one of its most intense long/short battles of the 2025–2026 cycle. Perpetual futures funding rates have swung wildly between positive (bulls paying bears) and negative (bears paying bulls), open interest remains elevated despite recent deleveraging, and price action oscillates in a tight $1,800–$2,200 range with frequent 5–12% intraday swings. This tug-of-war reflects classic indecision: bulls defend key technical levels and ecosystem catalysts (DeFipunk push, L2 scaling), while bears point to macro headwinds, L2 fragmentation, and persistent outflows from ETH ETFs.
The battle is amplified by high leverage — funding rates have hit extremes of +0.15% to -0.12% per 8 hours — and concentrated positioning, with liquidations routinely exceeding $150–300 million per major move.
1. Price Action – Current Levels & Battleground Zones
ETH remains trapped in a high-volatility compression zone after a 37%+ drawdown from early-February highs.
Current price: $2,079–$2,090 (real-time spot/futures convergence)
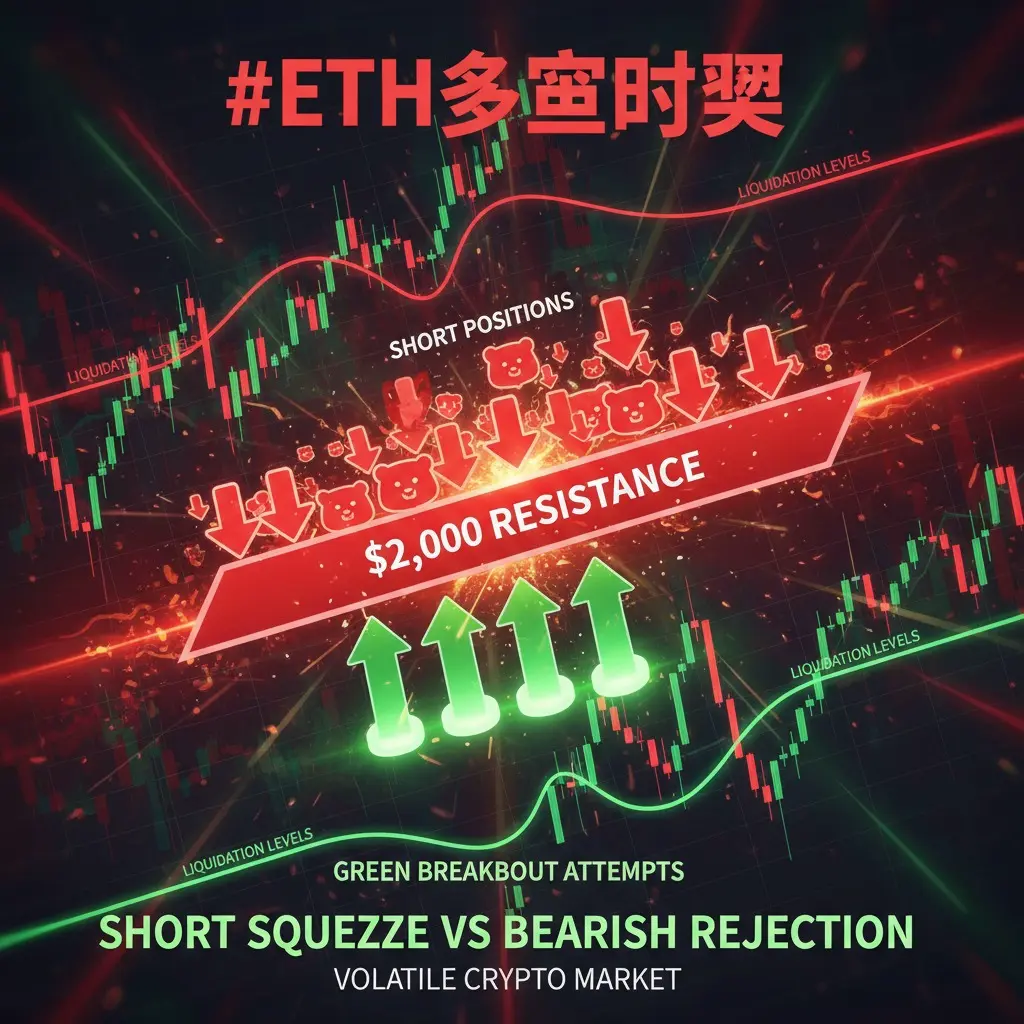
24-hour change: +11.7% (sharp short squeeze from $1,825–$1,875 lows)
7-day change: +7.2% (partial recovery after mid-week capitulation)
30-day change: +28.3% overall month (volatile; deep troughs offset by rebounds)
Key battle levels:
Support: $1,950–$2,000 (200-day EMA + prior range low)
Resistance: $2,200–$2,300 (50-day EMA + psychological barrier)
Breakout target: $2,500+ if funding turns sustainably positive
Breakdown risk: $1,700–$1,800 if longs capitulate
Momentum indicators: RSI (14) ~55 (neutral after oversold bounce); MACD histogram flipping positive but weak; funding rates oscillating ±0.05–0.12%.
2. Volume & Turnover – Conviction Behind the Moves
Volume spikes confirm aggressive positioning on both sides.
24-hour spot + derivatives volume: $26.76 billion USD (~10.7% of market cap)
Weekly DEX volume (Ethereum ecosystem): ~$20.11 billion (lagging Solana but resilient on L2s)
Perpetual futures volume peak: Multi-billion bursts during squeezes/liquidations
Daily volume range (February): $18.5–65 billion (event-driven; battle days hit upper end)
Volume composition: ~60–70% spot/AMM, remainder perps/derivs; L2-driven for low-fee execution
On-chain transaction value: ~$40 billion/month; daily active addresses ~1.8 million (stable but not surging)
Liquidation spikes: $150–400 million+ per major swing (longs and shorts both hit hard)
3. Liquidity & Market Depth – Fragility in the Tug-of-War
Liquidity is thin and reactive — perfect conditions for violent moves.
Order book depth (±2% mid-price): $15–25 million on majors (contracted from late-2025 peaks)
Slippage on $10M+ orders: 0.5–3%+ (better on L2s like Base/Arbitrum)
Futures open interest: Stabilizing after -67% collapse (~$23B low → $30–35B range)
Bid/ask imbalance: Alternating; bid-heavy during squeezes, ask-heavy during breakdowns
Liquidity concentration: Dominated by Aave, Uniswap, Maker, Curve; stablecoin supply locked ~$153 billion (~60% of major circulation)
Effective outlook: Depth improves on rallies; remains vulnerable to cascading liquidations
4. Long/Short Metrics – Leverage & Positioning Snapshot
The core of the battle lives in derivatives.
Funding rate range (last 30 days): -0.12% to +0.15% per 8 hours (extreme swings)
Current funding rate: Near neutral (~0.01–0.03%) after squeeze exhaustion
Long/short ratio (major exchanges): ~1.05–1.15 (slight long bias post-rebound)
Open interest composition: ~55–60% longs, 40–45% shorts (balanced but volatile)
Liquidation events: $400–500M+ total in February peaks; longs hit harder during breakdowns, shorts during squeezes
Leverage usage: Average 5–10x on perps;
extremes 20–50x during momentum trades
5. Dominance & Percentage Breakdowns – Structural View
ETH's ecosystem positioning shows resilience amid the fight.
ETH/BTC ratio: ~0.030–0.032 (stable but under pressure)
Global crypto market cap share: ~16–18% (BTC dominance 55–60%)
DeFi TVL share: 55–60% (~$51–56B Ethereum-specific vs. $96–110B global)
L2 share within Ethereum: Base (~46%), Arbitrum (~31%), top 3 ~83% of L2 TVL
Protocol concentration: Top lending/DEX ~30–50% of chain TVL
Staked/locked ETH: ~53% of supply (Lido + others)
Stablecoin dominance on Ethereum: ~60% of major supply in DeFi
6. On-Chain & Sentiment Layers – Underlying Signals
On-chain: Whale accumulation in lower ranges; exchange inflows dropping on rallies; DeFipunk narrative gaining traction
Sentiment: Fear & Greed ~35–45 (neutral-fear after extreme lows); social volume high on squeeze memes
Institutional: ETH ETF outflows resuming but slowing; corporate interest stable
7. Macro & External Drivers – Bigger Picture
Macro headwinds: Fed uncertainty, tariff escalation, risk-off flows
Macro tailwinds: Oversold conditions, potential macro relief (Nvidia earnings, tariff softening)
Crypto-specific: DeFipunk push vs. L2 fragmentation debate
8. Multi-Horizon Scenarios
Short-term (0–4 weeks): Range-bound $1,900–$2,300 likely; breakout above $2,200 → 15–25% extension; breakdown below $1,950 → retest $1,700–$1,800
Medium-term (3–9 months): Base $2,500–$3,500 if catalysts align; bull $4,000+ on adoption; bear $1,200–$1,500 on macro shock
Long-term cycle: Still within 2025–2027 framework; current battle typical mid-cycle chop
Closing Summary
The ETH long/short battle in February 2026 is fierce: funding swings, liquidations in the hundreds of millions, and thin liquidity create explosive 5–12% moves within hours. Price at ~$2,079 (+11.7% 24h), volume $26.76B, dominance stable at 55–60% DeFi share — bulls hold technicals and narrative, bears press macro and outflows.
Resolution likely requires a decisive catalyst (DeFipunk shipping, macro relief, or capitulation). Until then, expect continued volatility and leverage-driven swings.
Ethereum is locked in one of its most intense long/short battles of the 2025–2026 cycle. Perpetual futures funding rates have swung wildly between positive (bulls paying bears) and negative (bears paying bulls), open interest remains elevated despite recent deleveraging, and price action oscillates in a tight $1,800–$2,200 range with frequent 5–12% intraday swings. This tug-of-war reflects classic indecision: bulls defend key technical levels and ecosystem catalysts (DeFipunk push, L2 scaling), while bears point to macro headwinds, L2 fragmentation, and persistent outflows from ETH ETFs.
The battle is amplified by high leverage — funding rates have hit extremes of +0.15% to -0.12% per 8 hours — and concentrated positioning, with liquidations routinely exceeding $150–300 million per major move.
1. Price Action – Current Levels & Battleground Zones
ETH remains trapped in a high-volatility compression zone after a 37%+ drawdown from early-February highs.
Current price: $2,079–$2,090 (real-time spot/futures convergence)
24-hour change: +11.7% (sharp short squeeze from $1,825–$1,875 lows)
7-day change: +7.2% (partial recovery after mid-week capitulation)
30-day change: +28.3% overall month (volatile; deep troughs offset by rebounds)
Key battle levels:
Support: $1,950–$2,000 (200-day EMA + prior range low)
Resistance: $2,200–$2,300 (50-day EMA + psychological barrier)
Breakout target: $2,500+ if funding turns sustainably positive
Breakdown risk: $1,700–$1,800 if longs capitulate
Momentum indicators: RSI (14) ~55 (neutral after oversold bounce); MACD histogram flipping positive but weak; funding rates oscillating ±0.05–0.12%.
2. Volume & Turnover – Conviction Behind the Moves
Volume spikes confirm aggressive positioning on both sides.
24-hour spot + derivatives volume: $26.76 billion USD (~10.7% of market cap)
Weekly DEX volume (Ethereum ecosystem): ~$20.11 billion (lagging Solana but resilient on L2s)
Perpetual futures volume peak: Multi-billion bursts during squeezes/liquidations
Daily volume range (February): $18.5–65 billion (event-driven; battle days hit upper end)
Volume composition: ~60–70% spot/AMM, remainder perps/derivs; L2-driven for low-fee execution
On-chain transaction value: ~$40 billion/month; daily active addresses ~1.8 million (stable but not surging)
Liquidation spikes: $150–400 million+ per major swing (longs and shorts both hit hard)
3. Liquidity & Market Depth – Fragility in the Tug-of-War
Liquidity is thin and reactive — perfect conditions for violent moves.
Order book depth (±2% mid-price): $15–25 million on majors (contracted from late-2025 peaks)
Slippage on $10M+ orders: 0.5–3%+ (better on L2s like Base/Arbitrum)
Futures open interest: Stabilizing after -67% collapse (~$23B low → $30–35B range)
Bid/ask imbalance: Alternating; bid-heavy during squeezes, ask-heavy during breakdowns
Liquidity concentration: Dominated by Aave, Uniswap, Maker, Curve; stablecoin supply locked ~$153 billion (~60% of major circulation)
Effective outlook: Depth improves on rallies; remains vulnerable to cascading liquidations
4. Long/Short Metrics – Leverage & Positioning Snapshot
The core of the battle lives in derivatives.
Funding rate range (last 30 days): -0.12% to +0.15% per 8 hours (extreme swings)
Current funding rate: Near neutral (~0.01–0.03%) after squeeze exhaustion
Long/short ratio (major exchanges): ~1.05–1.15 (slight long bias post-rebound)
Open interest composition: ~55–60% longs, 40–45% shorts (balanced but volatile)
Liquidation events: $400–500M+ total in February peaks; longs hit harder during breakdowns, shorts during squeezes
Leverage usage: Average 5–10x on perps;
extremes 20–50x during momentum trades
5. Dominance & Percentage Breakdowns – Structural View
ETH's ecosystem positioning shows resilience amid the fight.
ETH/BTC ratio: ~0.030–0.032 (stable but under pressure)
Global crypto market cap share: ~16–18% (BTC dominance 55–60%)
DeFi TVL share: 55–60% (~$51–56B Ethereum-specific vs. $96–110B global)
L2 share within Ethereum: Base (~46%), Arbitrum (~31%), top 3 ~83% of L2 TVL
Protocol concentration: Top lending/DEX ~30–50% of chain TVL
Staked/locked ETH: ~53% of supply (Lido + others)
Stablecoin dominance on Ethereum: ~60% of major supply in DeFi
6. On-Chain & Sentiment Layers – Underlying Signals
On-chain: Whale accumulation in lower ranges; exchange inflows dropping on rallies; DeFipunk narrative gaining traction
Sentiment: Fear & Greed ~35–45 (neutral-fear after extreme lows); social volume high on squeeze memes
Institutional: ETH ETF outflows resuming but slowing; corporate interest stable
7. Macro & External Drivers – Bigger Picture
Macro headwinds: Fed uncertainty, tariff escalation, risk-off flows
Macro tailwinds: Oversold conditions, potential macro relief (Nvidia earnings, tariff softening)
Crypto-specific: DeFipunk push vs. L2 fragmentation debate
8. Multi-Horizon Scenarios
Short-term (0–4 weeks): Range-bound $1,900–$2,300 likely; breakout above $2,200 → 15–25% extension; breakdown below $1,950 → retest $1,700–$1,800
Medium-term (3–9 months): Base $2,500–$3,500 if catalysts align; bull $4,000+ on adoption; bear $1,200–$1,500 on macro shock
Long-term cycle: Still within 2025–2027 framework; current battle typical mid-cycle chop
Closing Summary
The ETH long/short battle in February 2026 is fierce: funding swings, liquidations in the hundreds of millions, and thin liquidity create explosive 5–12% moves within hours. Price at ~$2,079 (+11.7% 24h), volume $26.76B, dominance stable at 55–60% DeFi share — bulls hold technicals and narrative, bears press macro and outflows.
Resolution likely requires a decisive catalyst (DeFipunk shipping, macro relief, or capitulation). Until then, expect continued volatility and leverage-driven swings.