Highlights
①. Gate's "Basic Futures Contracts" course introduces various methods of technical analysis that are commonly employed in futures trading. The aim of these courses is to help traders establish a comprehensive framework for technical analysis. Covered topics include the basics of Candlestick charts, technical patterns, moving averages, trend lines, and the application of technical indicators.
②. In Course XVI of the "Master Technical Analysis" series, this article introduces the candlestick pattern known as the "Wedge." It delves into the concept, characteristics, technical significance, and its application in trading of this pattern.
1. What is a wedge?
A wedge pattern forms during market consolidation, characterized by price fluctuations occurring at a progressively diminishing pace. It is defined by the shape created by two converging trend lines, which connect the respective high and low points of the price's oscillation range. The pattern's visual similarity to a wedge gives it its name.
The wedge pattern can be categorized into two types: the ascending wedge and the descending wedge.
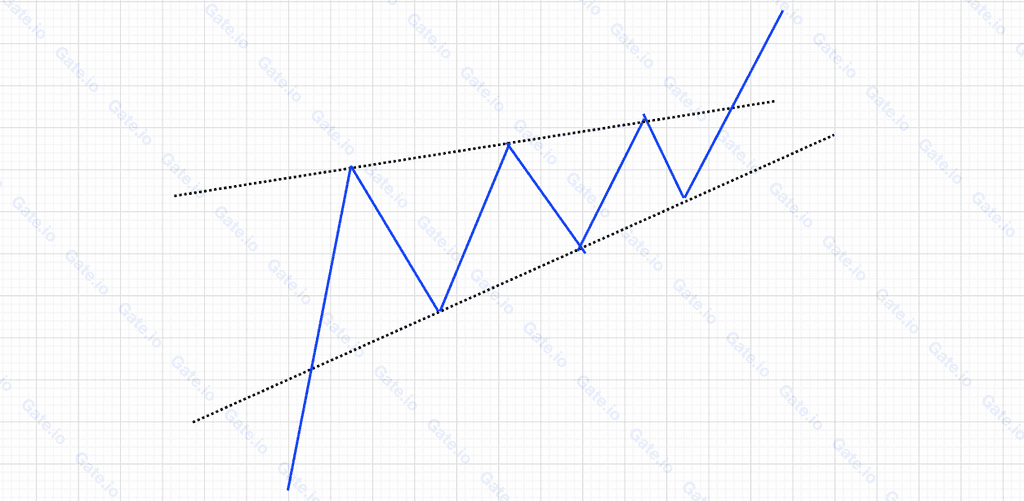
①. Ascending wedge
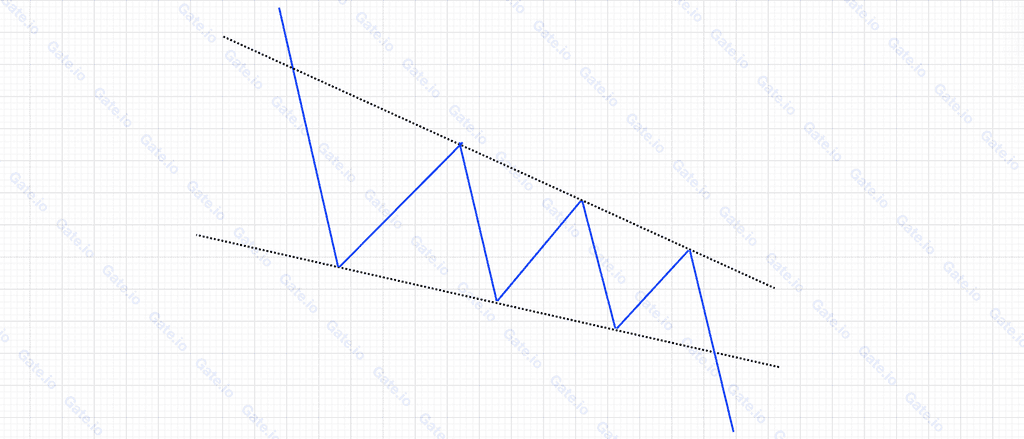
②.Descending wedge
2. Features of wedge
While a wedge can be geometrically categorized as a type of triangle, they are defined as distinct candlestick patterns in trading. The primary distinction lies in the orientation of the bottom edge. In a wedge, the lower edge slopes, drawing closer to the upper one, whereas in a triangle, the lower edge typically extends horizontally.
Ascending wedge
①. It generally appears in an upward trend;
②. With every rebound, the high point is higher than the previous high, and the low point is also higher than the previous low;
③. The overall trading volume gradually diminishes during the formation of this pattern.
Descending wedge
①. It generally appears in a downward trend;
②. With every rebound, the high point is lower than the previous high, and the low point is also lower than the previous low;
③. The overall trading volume gradually diminishes during the formation of the pattern.
3. What is the technical meaning of the wedge?
When the upper edge of the wedge is breached, the market is anticipated to rise, signaling a potential buying opportunity. Conversely, if the lower edge of the wedge is broken, the market is expected to decline, suggesting a selling opportunity.
4. Application
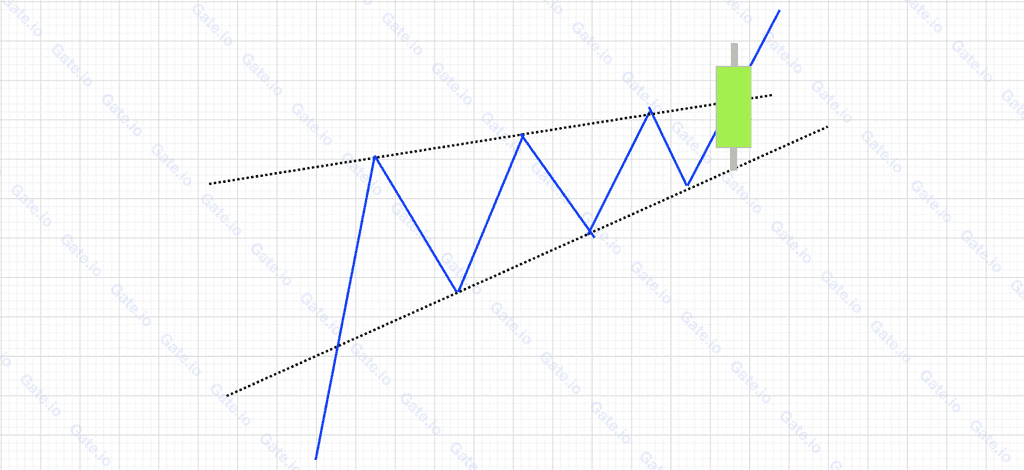
①. When the wedge is surpassed at the upper edge, the market is expected to rise, and it signals a buy opportunity, as indicated below:
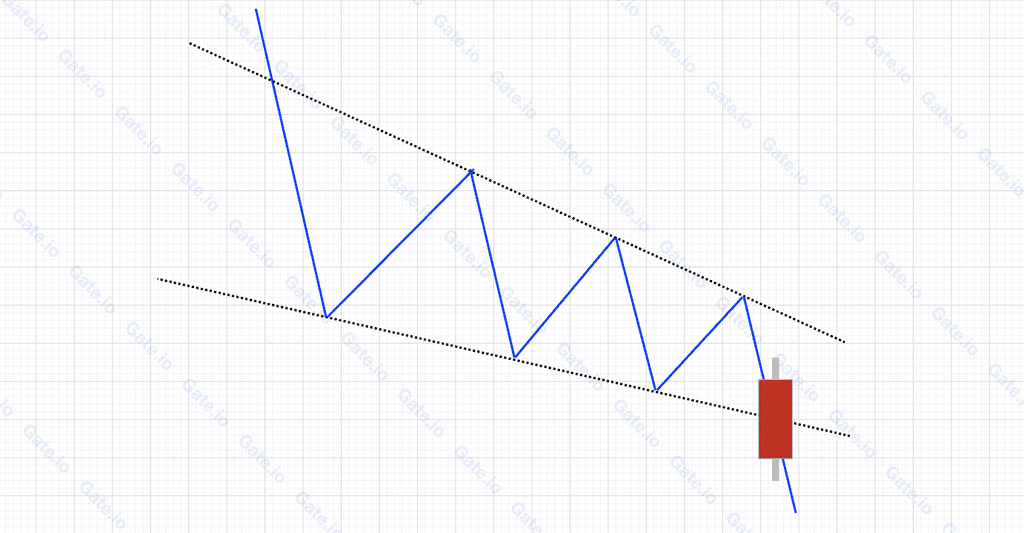
②. If the wedge is broken at the lower edge, the market is expected to decline, and it is time to sell, as indicated below:
5. Use Case
①. Ascending wedge
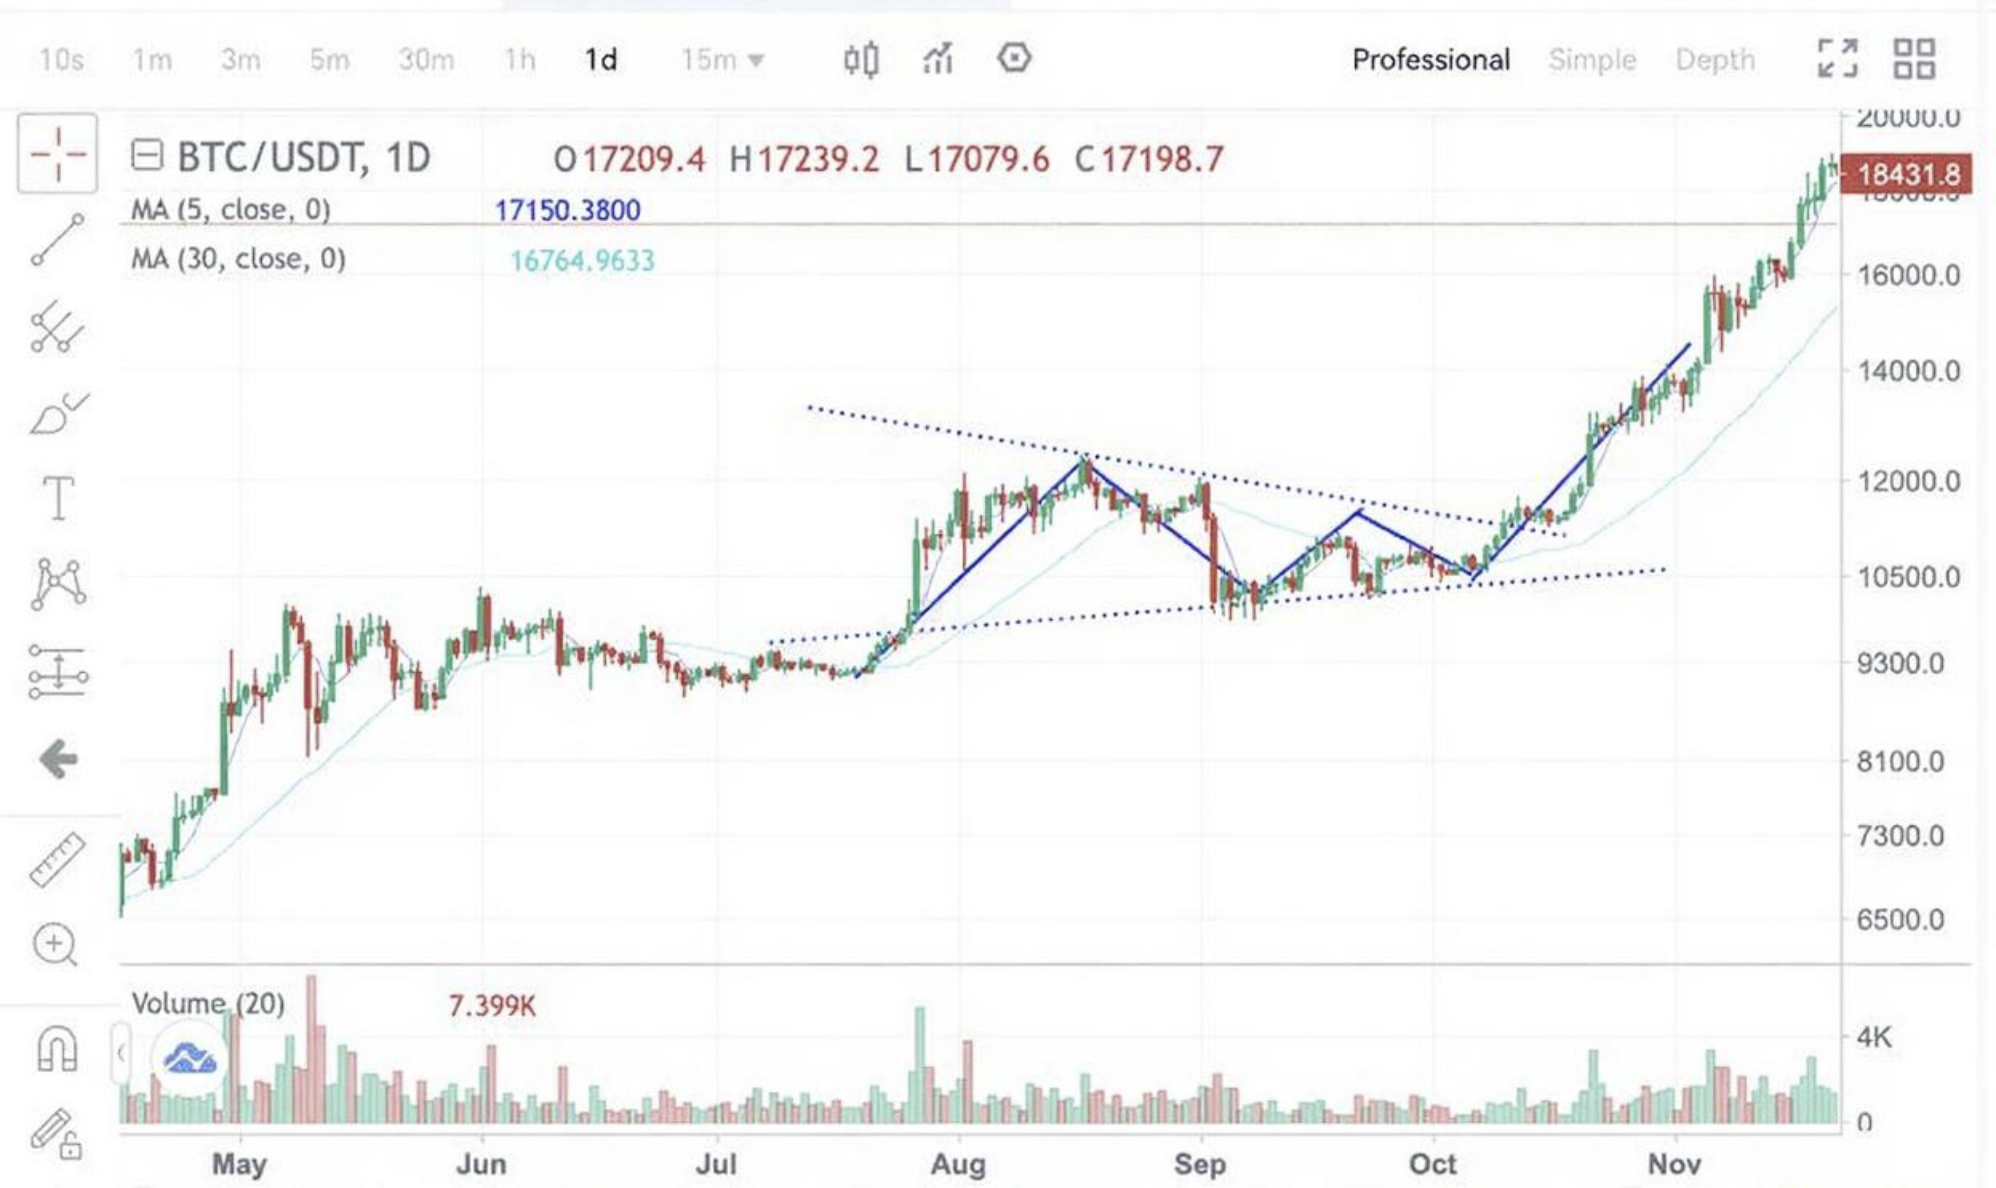
The chart above represents the BTC/USDT daily chart on Gate, spanning from June 1, 2020, to November 1, 2020. Following a surge, the market began to oscillate within a defined range, manifesting as an ascending wedge pattern. The coin price subsequently broke through the upper boundary of the wedge at $11,000. This breach paved the way for a bullish trend that propelled the market to a peak above $20,000, marking a cumulative increase of up to 107%.
②. Descending wedge
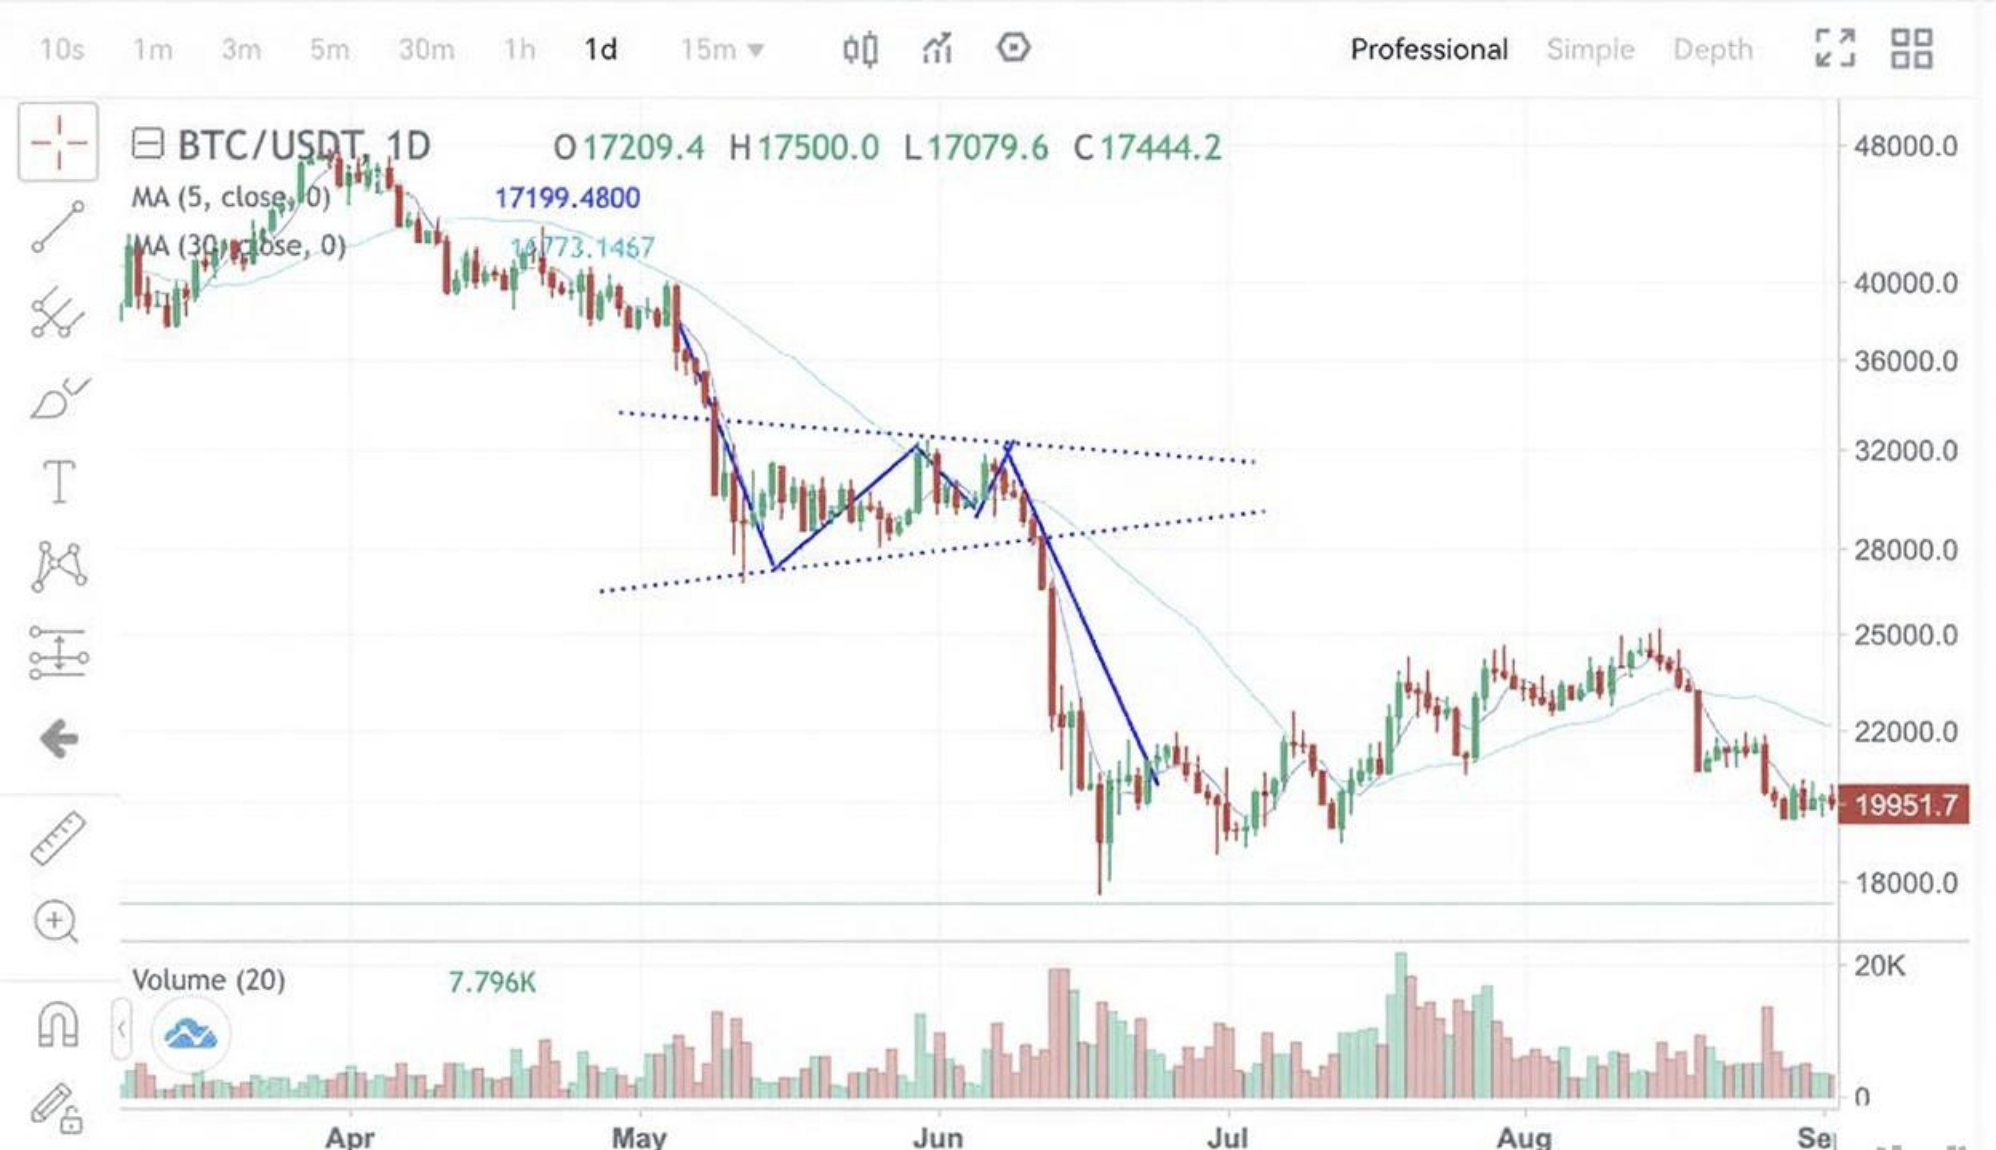
The chart above is the BTC/USDT daily chart on Gate. From May 5, 2022, to June 18, 2022, after a sharp decline, the market started to move sideways, gradually forming a descending wedge. When the coin price broke below the wedge's lower line at $29,500, it started a new bearish trend, hitting a low of $17,800, with a decline of up to 42%.
6. Summary
Regardless of whether we're discussing wedges, flags, or triangles, trading signals arise when the boundary of the pattern is breached. Specifically, if the upper edge of the pattern is surpassed, especially with an accompanying rise in trading volume, it's typically seen as a bullish signal, prompting traders to consider buying assets. On the other hand, a breach of the lower edge suggests a selling opportunity.
Start trading futures by registering on Gate Futures.

Disclaimer
This article is for informational purposes only and does not constitute investment advice. Gate is not responsible for any investment decisions you make. Content related to technical analysis, market assessments, trading skills, and traders' insights should not be considered a basis for investment. Investing carries potential risks and uncertainties. This article offers no guarantees or assurances of returns on any type of investment.
Disclaimer
The content provided herein is for reference and educational purposes only and does not constitute any financial, investment, trading, or legal advice, nor does it constitute an offer or solicitation to buy or sell any digital assets. Gate makes no express or implied representations or warranties regarding the accuracy, completeness, or timeliness of the information contained herein. Product features, interfaces, rules, and fee structures may be updated or adjusted at any time. Please refer to the latest announcements and the actual information displayed on the Gate platform for the most accurate details.
Digital asset investments involve significant risk, and prices may fluctuate substantially. You may lose the entire amount of your investment. Please make decisions cautiously based on your own financial situation and risk tolerance after fully understanding the associated risks. If necessary, you are advised to consult an independent professional financial or legal advisor.
For more information about potential risks, please refer to Gate's Risk Disclosure and User Agreement.
