
According to SoSoValue data, U.S. spot Bitcoin ETFs experienced approximately $568 million in net inflows this week. Combined with last week’s $787 million, this marks the first consecutive two-week positive growth for these funds in five months. Prior to this inflow cycle, U.S. spot Bitcoin ETFs had experienced five consecutive weeks of outflows, totaling about $3.8 billion.
Two-Week Inflow Data: Quantitative Reflection of a Turning Point
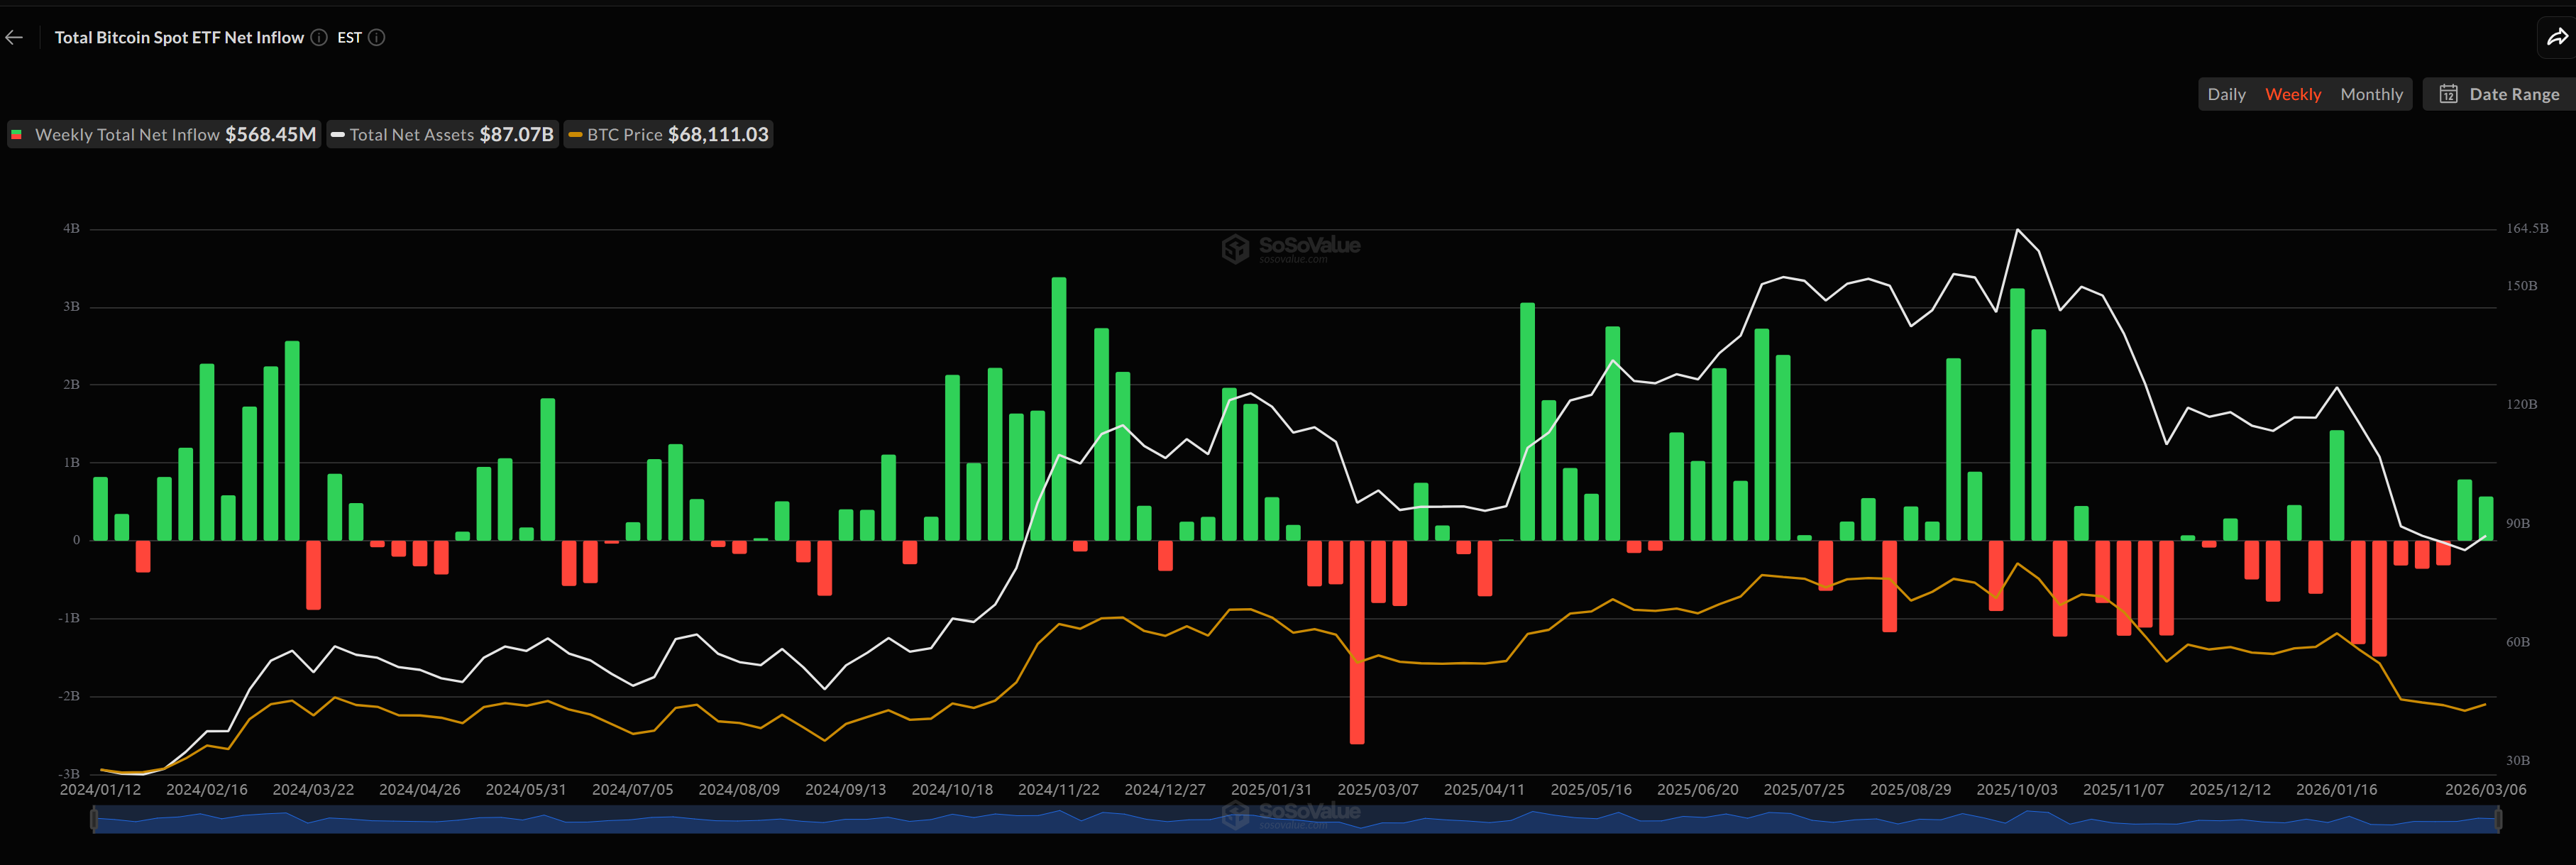
(Source: SoSoValue)
The two-week consecutive inflow indicates a technical reversal in capital flow, but the underlying data remains noteworthy:
Inflow last week: $787 million, confirming the trend shift observed in the first week
Inflow this week: $568 million, with some capital retracement over the weekend
Total inflow over two weeks: approximately $1.355 billion
Previous five weeks of outflows: about $3.8 billion, with the largest single-week outflow around $1.49 billion
While the total net inflow over two weeks (~$1.355 billion) has not fully offset the previous capital deficit, the change in flow direction is regarded by the market as an important signal of renewed institutional confidence.
Daily Capital Movements This Week: Strong Start, Retracement at Weekend
This week, Bitcoin ETF daily capital flows showed a clear pattern of “strong at the start, weaker at the weekend.” On Monday, $458 million flowed in, and on Wednesday, $462 million, indicating concentrated institutional buying mid-month. However, Thursday and Friday recorded net outflows of $228 million and $349 million respectively, as some holders took profits after a brief market rebound, ending the previous streak of inflows.
U.S. spot Ethereum ETFs also recorded a second consecutive week of net inflows. This week’s net inflow was about $23.56 million, compared to $80.46 million last week. This is the first time since early October last year that Ethereum ETFs have experienced two consecutive weeks of positive growth. Previously, Ethereum ETFs faced five weeks of continuous outflows, with total outflows exceeding $1.38 billion, and the largest weekly outflow was $611 million as of the week ending January 23.
Historical Comparison of Gold ETFs: Bitcoin ETF Catching Up to 15 Years in 2 Years
Blockstream Marketing Director Fernando Nikolić posted on X that although gold has over 15 years of early market advantage in ETFs, Bitcoin ETFs have reached about 15 years’ worth of cumulative capital inflows in less than two years. Nikolić emphasized that this milestone was achieved despite Bitcoin’s price dropping 46% from its peak and several months of weak market performance, demonstrating strong institutional demand and resilience.
Frequently Asked Questions
What is the significance of two consecutive weeks of Bitcoin ETF inflows?
This is the first time in five months that U.S. spot Bitcoin ETFs have experienced two consecutive weeks of net positive inflows, after five weeks of cumulative outflows totaling about $3.8 billion. The two-week inflow confirms a preliminary shift in capital flow trend at a technical level, but the total of approximately $1.355 billion still has not fully offset the previous capital deficit.
Why did Bitcoin ETF experience a reversal from outflows to inflows over the weekend this week?
On Thursday and Friday, Bitcoin ETFs recorded net outflows of $228 million and $349 million respectively, ending the early-week streak of inflows. This typically reflects profit-taking behavior after a brief market rally or routine risk reduction by institutional investors before the weekend.
What does the comparison between two years for Bitcoin ETF and fifteen years for Gold ETF indicate?
This comparison, highlighted by Blockstream’s Fernando Nikolić, underscores the rapid acceptance of Bitcoin by institutional markets. While gold ETFs took 15 years to accumulate similar levels of capital inflow, Bitcoin ETFs achieved this in less than two years, even amid a 46% decline from their peak, indicating strong institutional willingness for long-term allocation to Bitcoin.
Disclaimer: The information on this page may come from third parties and does not represent the views or opinions of Gate. The content displayed on this page is for reference only and does not constitute any financial, investment, or legal advice. Gate does not guarantee the accuracy or completeness of the information and shall not be liable for any losses arising from the use of this information. Virtual asset investments carry high risks and are subject to significant price volatility. You may lose all of your invested principal. Please fully understand the relevant risks and make prudent decisions based on your own financial situation and risk tolerance. For details, please refer to
Disclaimer.
Related Articles
ETH drops 0.58% in 15 minutes: derivatives liquidity contraction and proactive position reduction dominate short-term pullback
From 2026-04-19 04:30 to 2026-04-19 04:45 (UTC), within ETH’s 15-minute candlestick chart, the return recorded -0.58%, and the price range was 2321.62 to 2342.04 USDT, with an amplitude of 0.87%. The short-term selloff occurred against a backdrop of increased overall market volatility and a broad decline in the prices of major crypto assets; overall market risk appetite clearly fell, and traders’ wait-and-see sentiment strengthened.
The main driver behind this abnormal move is a sharp contraction in liquidity in the derivatives market and leveraged funds proactively reducing positions. Data shows that over the past 24 hours, the ETH/USD perpetual contract trading volume dropped 67.16% to approximately 74.87 million, open interest edged down 3.33% to 329 million, and liquidation amounts did not expand unusually. This structure indicates that the market lacks the risk of passive cascades; more funds chose to proactively step aside and wait on the sidelines, intensifying short-term selling pressure.
In addition, the long/short structure in which shorts held the upper hand (long/short ratio 47.48%:52.52%) and sentiment synchronization with the panic range reinforced the downward price trend. During the same period, major coins such as BTC and SOL also fell 2%-3.4% in tandem, further showing that this pullback was driven by system-wide risk sentiment. On-chain funds did not show any large abnormal transfers or large-scale liquidations of DeFi protocols; spot and on-chain liquidity remained generally stable, and no sudden system risk resonance was observed.
Current volatility-related risks still need close monitoring, especially as overall risk appetite continues to contract—ETH’s short-term price may face further downside probing. Watch subsequent changes in derivatives trading volume and open interest, extreme shifts in the long/short ratio and funding rate, and promptly monitor on-chain fund flows, large transfers, and any signs of amplified platform net outflows. For more market anomalies and deeper analysis, please continue to follow our upcoming market updates.
GateNews42m ago
Spark Protocol's January delisting of rsETH proves prudent as Aave faces ETH liquidity crisis
Spark Protocol's strategy of delisting low-usage assets and tightening collateral has faced initial backlash but proved wise during market turmoil. While maintaining higher interest rate caps, SparkLend ensures liquidity, unlike Aave, which now faces significant risks.
GateNews1h ago
Ethereum Processes 200M Transactions in Q1 2026, Up 43% QoQ
Ethereum experienced its highest quarterly transaction volume in Q1 2026 with over 200 million transactions, marking 43% growth from the previous quarter. Layer 2 solutions and stablecoin usage drove this surge, indicating a utility-focused adoption trend.
GateNews15h ago
Ethereum Co-founder Lubin: AI Will Be Critical Turning Point for Crypto, But Tech Giant Monopoly Poses Systemic Risk
Ethereum co-founder Joseph Lubin emphasized the transformative potential of AI for the cryptocurrency sector while cautioning against the risks of centralization among tech giants. He envisions AI-driven autonomous transactions on blockchain and highlights the convergence of traditional finance with DeFi.
GateNews15h ago
