
Looking at the weekly chart, the structure on LINK becomes pretty clear. What we are looking at is a classic head-and-shoulders pattern that has been forming since 2024.
The left shoulder took shape in the low to mid $20s, then LINK price pushed higher to form the head near the upper $20s, and after that, the right shoulder rolled over again around similar levels.
What really stands out here is the neckline. It is not flat, but slightly rising, and it comes in right around the $10 to $11 zone. That is why the LINK price is now sitting at such a sensitive level. This is not just another support. It is the level that decides whether this entire structure breaks down or not.
Why $10–$11 Is Critical For LINK, With Lower Levels Below
CryptoBullet’s main message is simple and hard to argue with. If the LINK price loses the $10–$11 support area on a weekly close, things can turn ugly quickly. On a chart like this, a weekly close matters far more than a random wick or a quick dip.
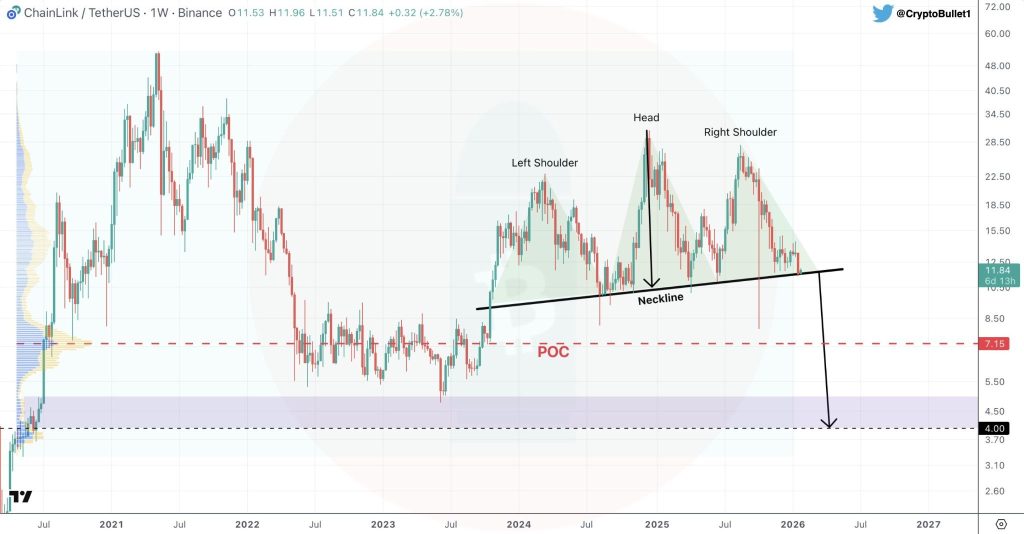
Source: X/@CryptoBullet1
Just below that, around $7.15, sits what he calls the conservative downside target. This level is not picked randomly. It lines up with the volume point of control and with the accumulation zone from 2022 and 2023. In other words, this is where LINK previously spent a lot of time trading, so if price starts sliding, that zone naturally becomes the next place the market looks toward.
If the head-and-shoulders plays out fully, the measured move points toward the $4–$5 area. That is the deeper target mentioned in the tweet, and it matches the lower demand zone visible on the chart.
Getting to that level would depend on a general softness in the crypto space, not necessarily on LINK being lagging on its own. Nonetheless, it does provide a roadmap as long as sellers are in charge.
What Needs To Happen To Avoid This Breakdown
For this bearish setup to lose its grip, the LINK price needs to hold the $10 to $11 area and start building higher lows from there. Even better would be a clean reclaim and move back above the right shoulder zone, which would start to invalidate the pattern entirely.
Until that happens, the chart is very straightforward. The LINK price is sitting right on the line that separates a messy consolidation from a full weekly breakdown, and the next few weekly closes will likely decide which side wins.
Why Chainlink’s CCIP Is Turning LINK Into a Financial Infrastructure Play_**
Disclaimer: The information on this page may come from third parties and does not represent the views or opinions of Gate. The content displayed on this page is for reference only and does not constitute any financial, investment, or legal advice. Gate does not guarantee the accuracy or completeness of the information and shall not be liable for any losses arising from the use of this information. Virtual asset investments carry high risks and are subject to significant price volatility. You may lose all of your invested principal. Please fully understand the relevant risks and make prudent decisions based on your own financial situation and risk tolerance. For details, please refer to
Disclaimer.
Related Articles
ETH/BTC Price Ratio Rebounds to 0.0313 in Q1 2026 as Ethereum User Base Surges 82%
In Q1 2026, the Ethereum-to-Bitcoin price ratio reached a three-month high at 0.0313. Ethereum added 284,000 users and surpassed $180 billion in stablecoin supply. Bitcoin remained strong above $74,000, driven by significant ETF inflows.
GateNews3h ago
Why is Bitcoin up today? Trump says Iran is seeking a truce, and risk assets move higher across the board
On April 15, Bitcoin rebounded about 6% after Trump said Iran is seeking to reach an agreement, breaking above $75,000. Expectations for the resumption of U.S.-Iran negotiations warmed up, lifting Asian stock markets. Technically, roughly $6 billion worth of short positions were forced to close, accelerating the rebound. Analysts said that if the U.S.-Iran situation continues to ease, Bitcoin could break through $80,000, and they predicted it may reach $150,000 by year-end.
MarketWhisper7h ago
Bitmine is promoted to the NYSE main board! Tom Lee: US stocks may be at a bottom, and selling pressure on Ether could ease
Bitmine officially transferred from the NYSE American market to the main board, marking a significant milestone for the company. Despite a sharp drop in its share price, it still increased the share repurchase program to $4 billion. The company holds a large amount of Ether, and expects that a rebound in the crypto market will help improve its assets and share price performance.
CryptoCity7h ago
ETH 15-minute up 0.66%: On-chain large transfers in sync drove a net inflow of funds, boosting spot buying pressure
2026-04-15 00:00 to 00:15 (UTC), ETH shows a local anomaly. The 15-minute return rate is +0.66%. The trading price range is 2321.93–2343.2 USDT, with a range of 0.92%. During this period, market attention increased, volatility slightly intensified, buy pressure in the order book shifted upward in the short term, and quickly pushed spot prices up into a key resistance area.
The main drivers of this anomaly are large on-chain transfers and inflows of capital in combination. At the beginning of the window, multiple large ETH transfers appeared, including 8,676 ETH and 6,551 ETH, respectively, transferring from a large source to the
GateNews8h ago
BTC 15-minute drop of 0.54%: Liquidity worsens and whales actively reduce positions, putting short-term pressure on the market
From 22:15 to 22:30 (UTC) on 2026-04-14, BTC saw a short-term pullback of 0.54% within the high-range band of 73911.6 - 74314.4 USDT, with a return of -0.54%. During this period, market swings were evident, volatility intensified, attention from the market quickly increased, and downward pressure on the order book was prominent.
The main drivers behind this unusual move were the continued deterioration of market liquidity and a clear lack of order book depth, which made the BTC price extremely sensitive to large sell orders. At the same time, during the key time window, whale wallets carried out large transfers and also engaged in active de-risking,
GateNews9h ago
ETH 15-minute drop of 0.61%: Sell orders concentrate and release while bearish sentiment intensifies, increasing downward pressure
2026-04-14 22:15 to 2026-04-14 22:30 (UTC) during this period, on the 15-minute K-line, ETH recorded a -0.61% return, with a price range of 2313.68 to 2328.54 USDT and a fluctuation of 0.64%. During this period, market attention increased, trading volume expanded noticeably, and heightened short-term volatility sparked strong interest in the subsequent trend.
The main drivers behind this unusual move are the concentrated release of sell orders and continued net outflows of on-chain funds. Specifically, the sell volume share rose to 52%, higher than the buy side at 48%, indicating heavy selling pressure
GateNews9h ago
