
Key Takeaway
-
Ethereum (ETH) recorded its highest-ever daily transaction count, surpassing 2.59 million transactions.
-
The surge in on-chain activity signals growing network usage and demand.
-
ETH has broken out of an asymmetrical triangle pattern, confirming bullish momentum.
Ethereum (ETH) has quietly been building momentum, and the latest on-chain and technical signals suggest the market may be entering a decisive phase. Over the past week, ETH has climbed nearly 8%, extending its 30-day gain to around 14%, supported by a sharp rise in network activity and a technically significant breakout on the daily chart.
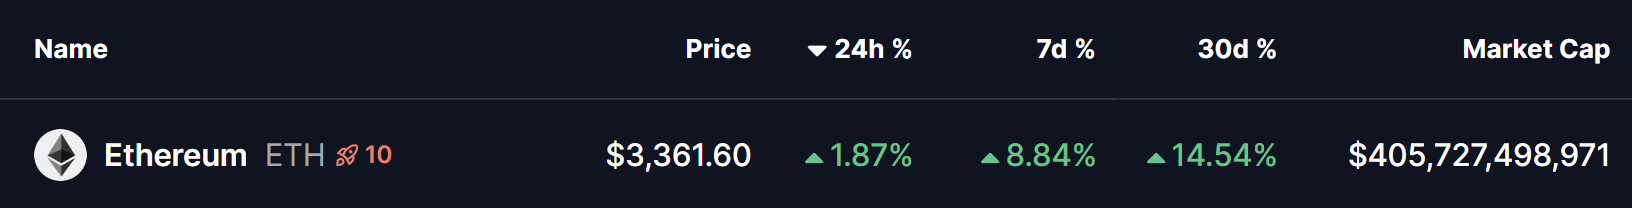
Source: Coinmarketcap
With Ethereum posting record-breaking transaction counts and price compressing into a bullish structure before breaking higher, traders are now watching closely to see whether this move can extend into a broader rally.
Ethereum (ETH) Hits Record Daily Transactions
Ethereum’s network activity just reached an all-time high. According to on-chain data from Etherscan, the blockchain processed 2,595,176 transactions on Wednesday, January 14, 2026, marking the highest daily transaction count in its history.
This milestone represents an 11.86% jump in daily transactions compared to recent averages and signals a notable increase in real usage across the Ethereum ecosystem. Rising transaction counts often reflect growing demand for decentralized applications, stablecoin transfers, Layer 2 interactions, and on-chain trading — all of which tend to strengthen the fundamental case for ETH.
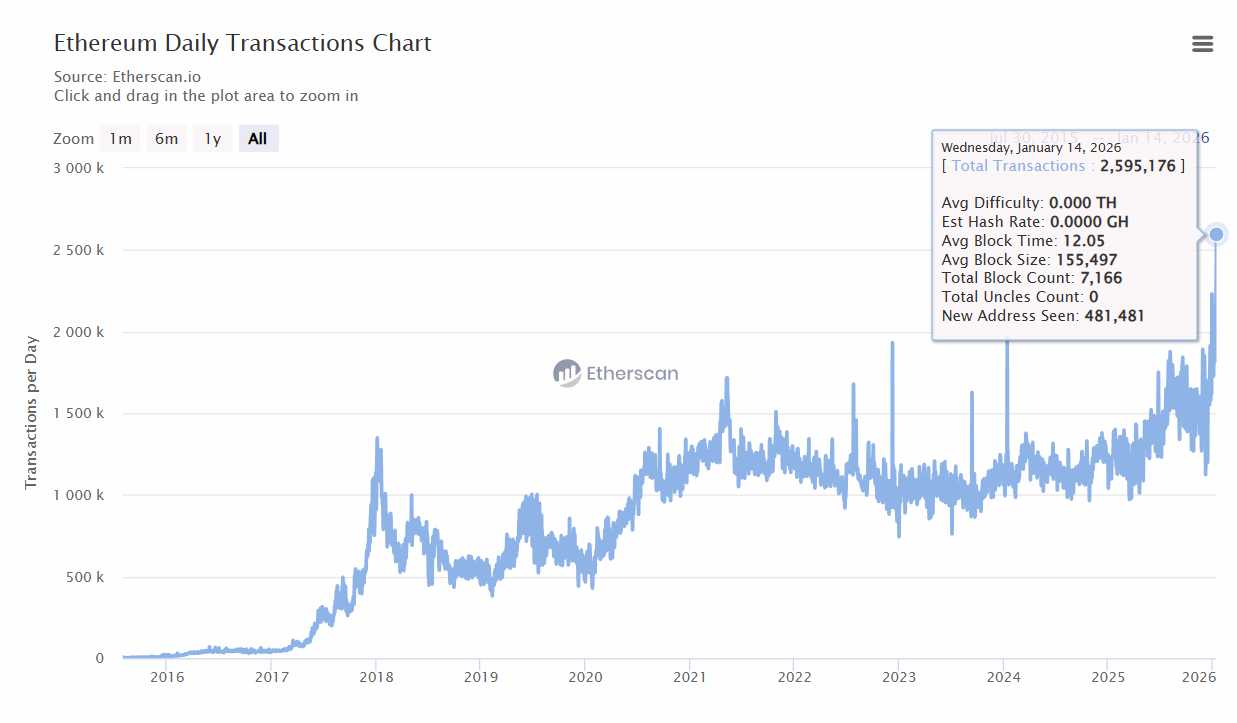
Ethereum (ETH) Daily Transactions/Source: etherscan
Historically, sustained increases in transaction activity have preceded periods of price expansion, as higher usage translates into greater demand for block space and ETH itself.
Could This Breakout Trigger ETH Higher?
From a technical perspective, Ethereum’s price action is aligning with the surge in on-chain activity.
On the daily chart, ETH has successfully broken out of an asymmetrical triangle pattern, a structure that typically signals trend continuation after a period of consolidation. The breakout occurred as ETH pushed decisively above the triangle’s descending resistance near $3,280, confirming buyer control.
Following the breakout, Ethereum rallied to a local high of approximately $3,405 on January 14, reinforcing the validity of the move. Importantly, price is now trading just above the 100-day moving average, a level that often acts as dynamic support during early trend reversals.
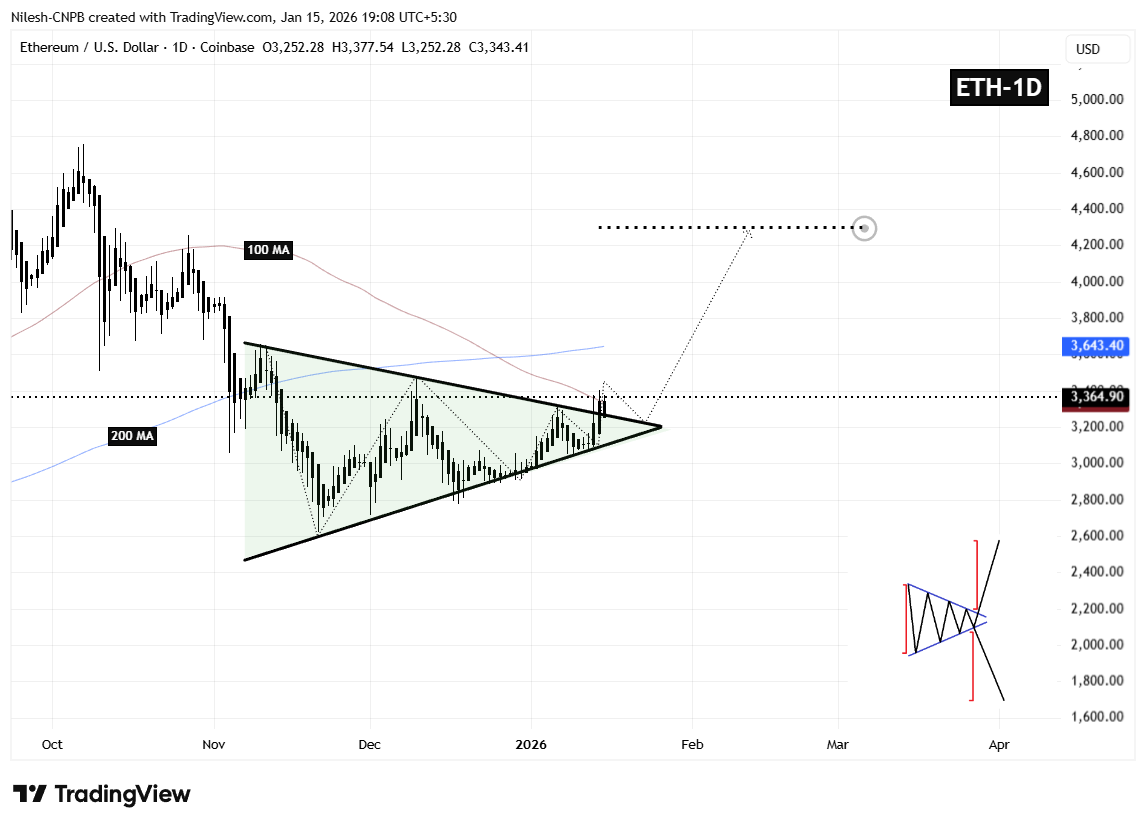
Ethereum (ETH) Daily Chart/Coinsprobe (Source: Tradingview)
A short period of consolidation or a modest retest of the breakout zone would be considered technically healthy. As long as ETH holds above the former resistance area, the broader bullish structure remains intact.
What’s Next for Ethereum (ETH)?
Looking ahead, the technical outlook remains constructive.
If Ethereum continues to hold above the breakout region and maintains strength above the 100-day moving average, the next major test lies at the 200-day moving average near $3,643. A successful reclaim of this level would likely attract additional momentum buyers and strengthen bullish conviction.
Beyond that, the measured move from the triangle pattern points toward a potential upside target near $4,300, representing roughly 27% upside from current price levels.
However, downside risk remains if ETH fails to sustain the breakout. A decisive move back below the former consolidation zone would weaken the bullish setup and increase the likelihood of a deeper pullback, potentially turning the recent surge into a failed breakout.
Bottom Line
Ethereum’s combination of record-setting network activity and a confirmed technical breakout places it at a critical inflection point. While short-term consolidation is possible, the broader structure favors the bulls as long as key support levels hold.
With on-chain usage accelerating and price breaking out of compression, Ethereum appears well-positioned for further upside — provided market conditions remain supportive.
Disclaimer: The views and analysis presented in this article are for informational purposes only and reflect the author’s perspective, not financial advice. Technical patterns and indicators discussed are subject to market volatility and may or may not yield the anticipated results. Investors are advised to exercise caution, conduct independent research, and make decisions aligned with their individual risk tolerance.
About Author: Nilesh Hembade is the Founder and Lead Author of Coinsprobe, with over 5 years of experience in the cryptocurrency and blockchain industry. Since launching Coinsprobe in 2023, he has been providing daily, research-driven insights through in-depth market analysis, on-chain data, and technical research.
Disclaimer: The information on this page may come from third parties and does not represent the views or opinions of Gate. The content displayed on this page is for reference only and does not constitute any financial, investment, or legal advice. Gate does not guarantee the accuracy or completeness of the information and shall not be liable for any losses arising from the use of this information. Virtual asset investments carry high risks and are subject to significant price volatility. You may lose all of your invested principal. Please fully understand the relevant risks and make prudent decisions based on your own financial situation and risk tolerance. For details, please refer to
Disclaimer.
