The Pi coin ( PI ) is currently around $0.4412, at a critical technical decision point. The price has been consistently constrained by the 50-day moving average ($0.5088) and the descending trend line formed since the April high, maintaining a weak structure of “lower lows and lower highs.” However, there has been a recent bullish divergence signal in the RSI, and the price has repeatedly found support in the $0.42-$0.44 support zone. If the daily chart closes effectively above the $0.51 resistance zone, it may trigger a short-term rally to $0.60-$0.70; conversely, if it loses the $0.42 level, it may dip to the $0.30 support.
Technical Dilemma: Oscillation within Descending Triangle, 50-day Moving Average Becomes Strong Resistance
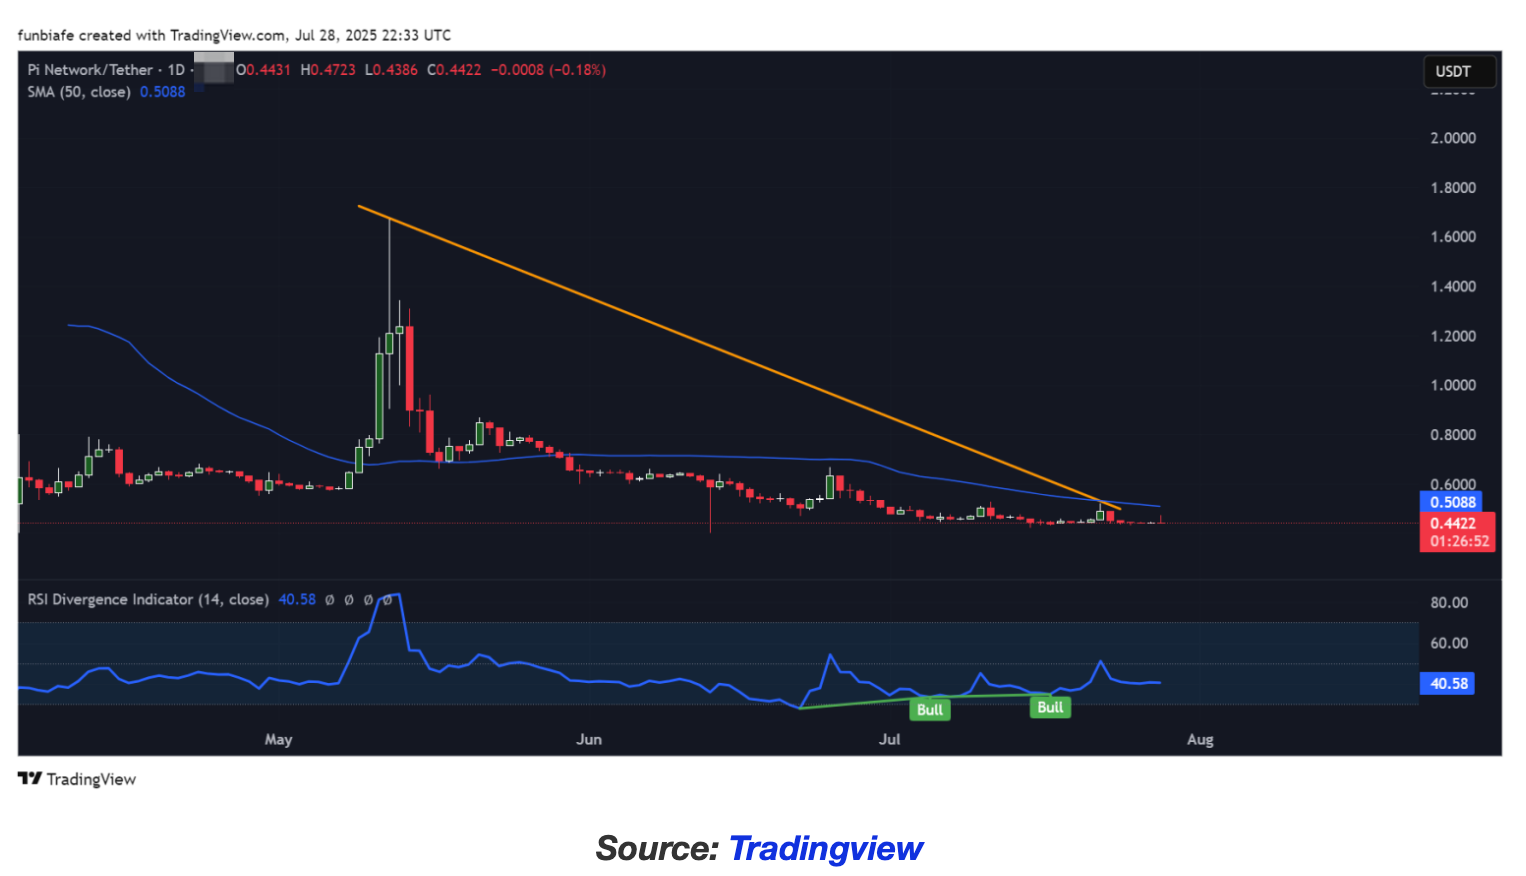 The price of Pi coin has significantly retraced after briefly breaking above $2.00 in April, forming a long-term descending triangle pattern:
- Key Resistance: The descending trend line connecting the high prices (extending from April to present) and the 50-day simple moving average (currently at $0.5088) create a strong resistance zone in the $0.50-$0.51 area.
- Historical Resistance: This resistance zone has successfully intercepted rebounds multiple times, with selling pressure triggered each time the price approaches.
- Support Base: Recently, the price has received buying support multiple times in the 0.42-0.44 USD range, forming a local defense line.
Potential Turning Point: Bullish Divergence in RSI Emerges, Bulls Await Breakout Signal
Technical indicators show positive signs:
- RSI bullish divergence: Although the price of PI coin has reached a new low, the Relative Strength Index ( RSI ) has formed a higher low (current value 40.58). Such divergences typically indicate a weakening of selling pressure and an increased probability of a trend reversal. This signal was marked as “Bull” (bullish) by the system as early as the beginning of July.
- Volume Coordination to be Observed: Currently, there has not yet been a breakout signal accompanied by significant volume, and the bulls still need to accumulate strength.
Bull-Bear Watershed: Breakthrough 0.51 USD or Break Down 0.42 USD
The price of PI coin is facing a directional choice:
- Bullish Scenario: If the daily chart closing price effectively stays above 0.51 USD, it will confirm a breakout from the dual pressure of the descending trend line and the 50-day moving average. This move may trigger short covering and technical buying, pushing the price to short-term rise to 0.60 USD, and subsequently challenge the 0.70 USD resistance zone.
- Bearish Scenario: If the price effectively breaks below the 0.42 USD support, the descending triangle pattern will continue, potentially opening up downside space, with the target pointing to the 0.30 USD key support level.
Conclusion: The Pi coin is currently in a critical technical game window. Although the RSI divergence suggests a weakening of the downward momentum, a valid breakout above the strong resistance zone of $0.50-$0.51 is needed to confirm a trend reversal. Investors should closely monitor the breakout situation of this resistance level on the daily chart, as well as the strength of defense at the $0.42 support. Until clear signals appear, the market maintains a neutral to cautiously optimistic stance (if a breakout occurs). Altcoin traders need to be wary of false breakout risks and can use changes in trading volume and the overall market trend for a comprehensive judgment. If a successful breakout occurs, the Pi coin may face an oversold rebound opportunity; if the support fails, further downside risks should be guarded against.
Disclaimer: The information on this page may come from third parties and does not represent the views or opinions of Gate. The content displayed on this page is for reference only and does not constitute any financial, investment, or legal advice. Gate does not guarantee the accuracy or completeness of the information and shall not be liable for any losses arising from the use of this information. Virtual asset investments carry high risks and are subject to significant price volatility. You may lose all of your invested principal. Please fully understand the relevant risks and make prudent decisions based on your own financial situation and risk tolerance. For details, please refer to
Disclaimer.
