This article uses the ETH/USDT perpetual futures page as an example to show you how to enable or disable the Order History markers on your chart. This helps you view or hide the indicators for your filled orders more intuitively.
1. How to Enable "Order History" on the Candlestick Chart
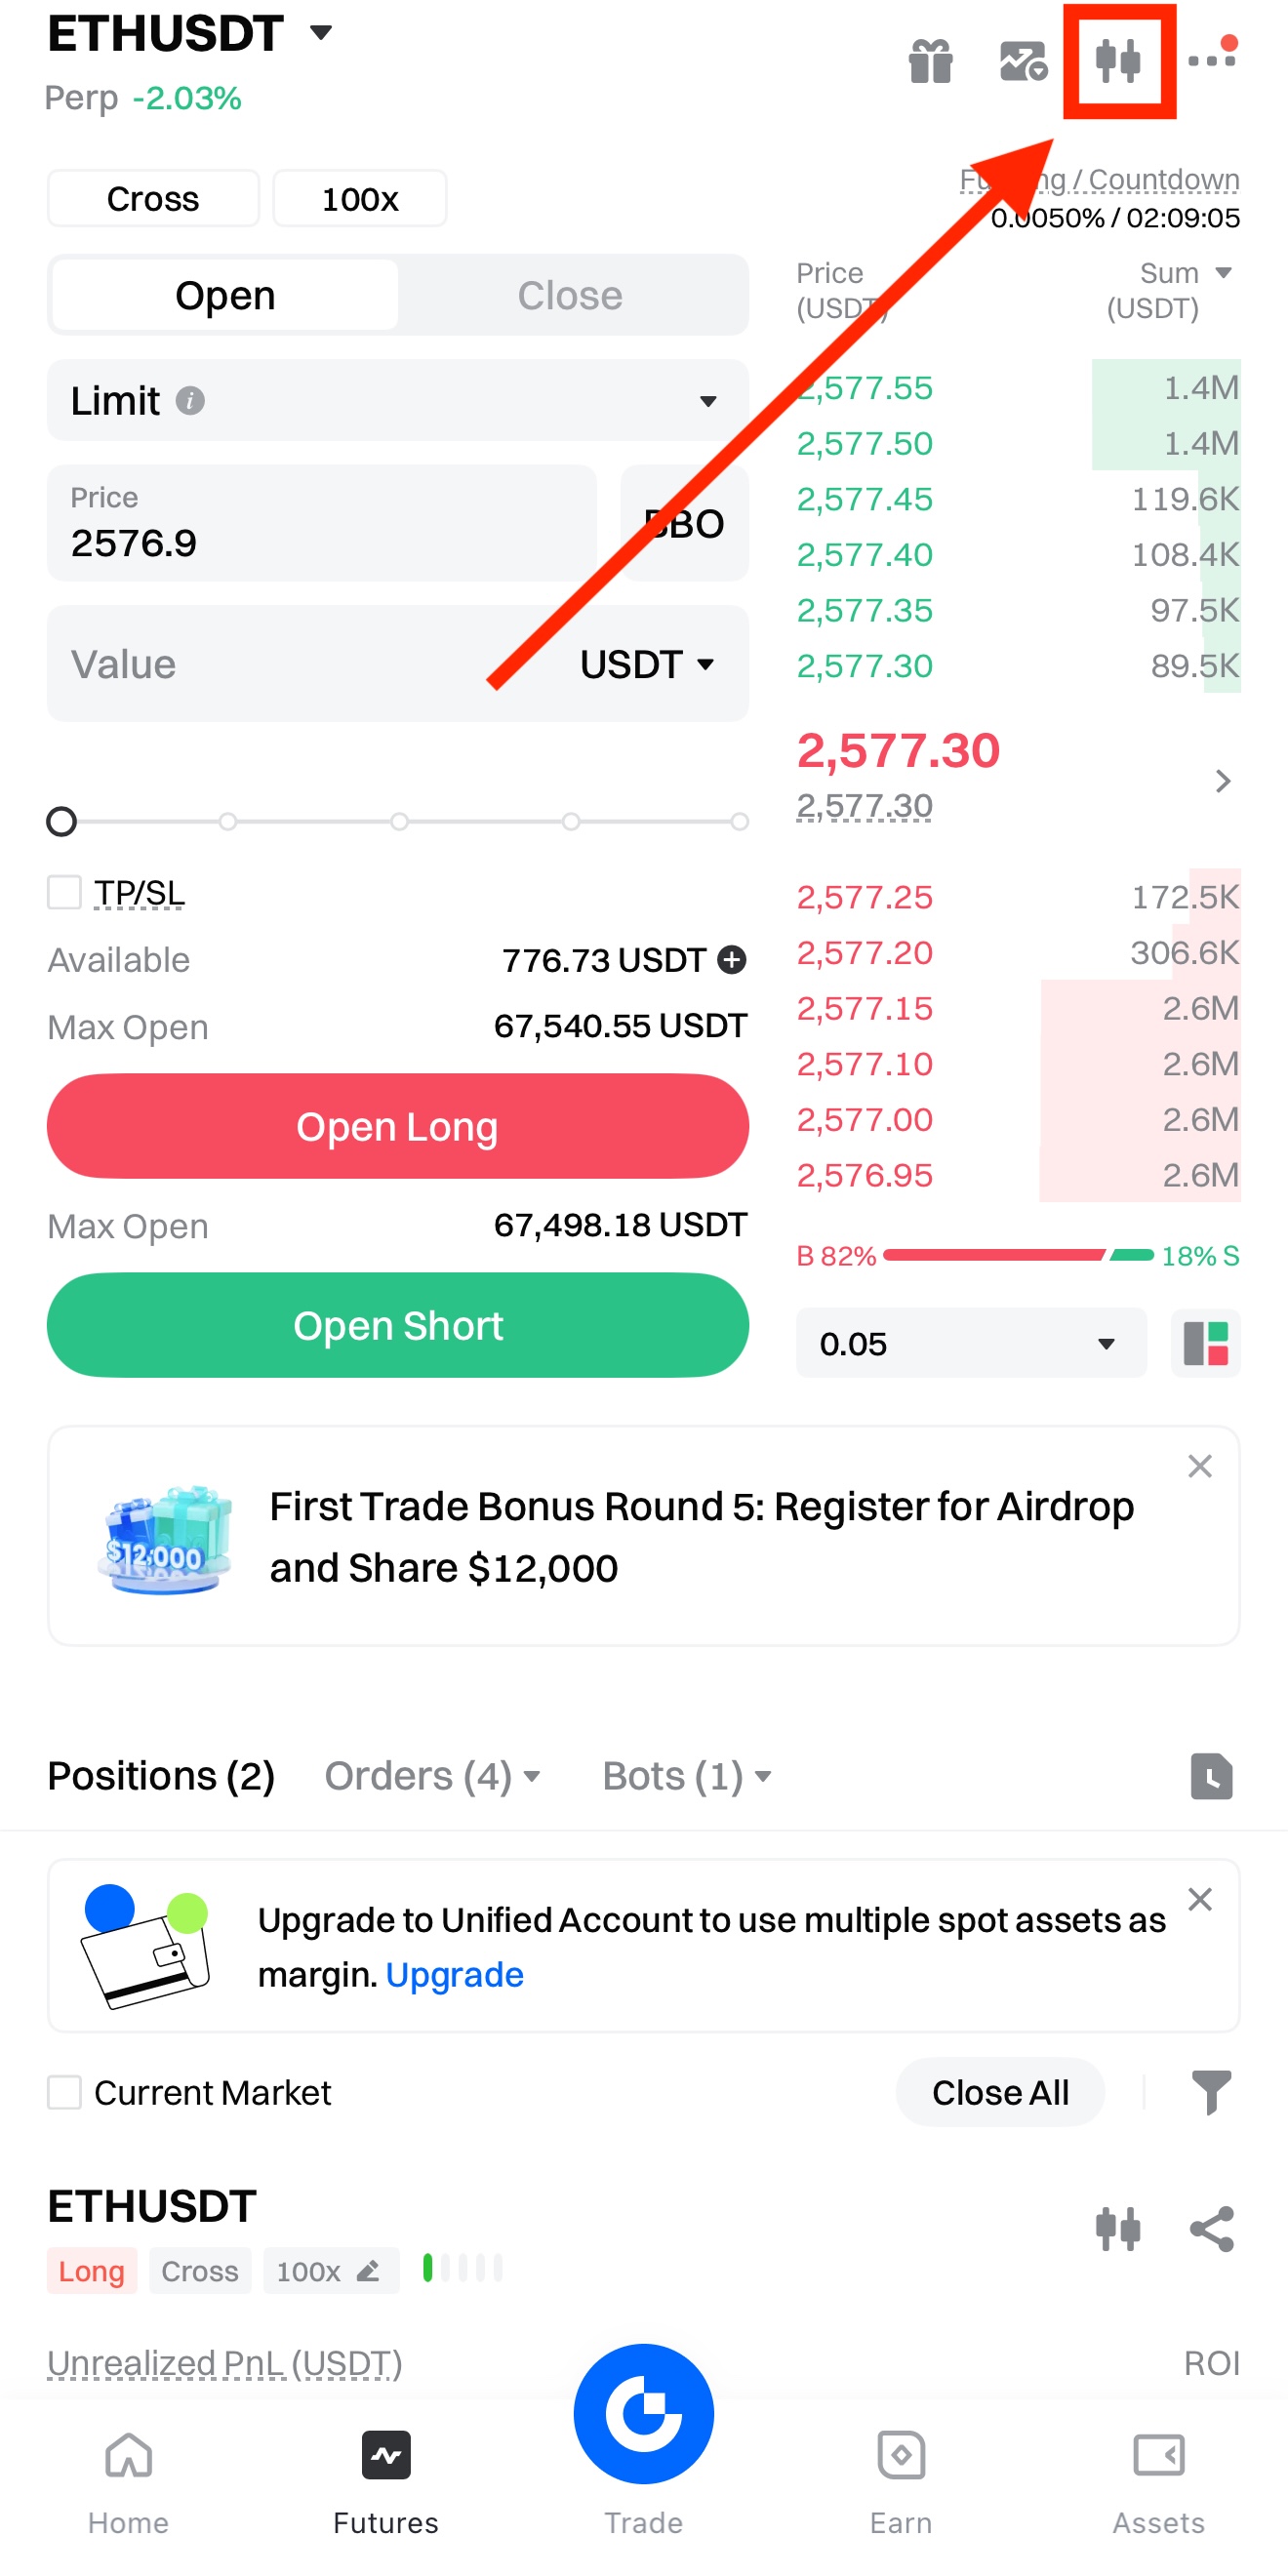
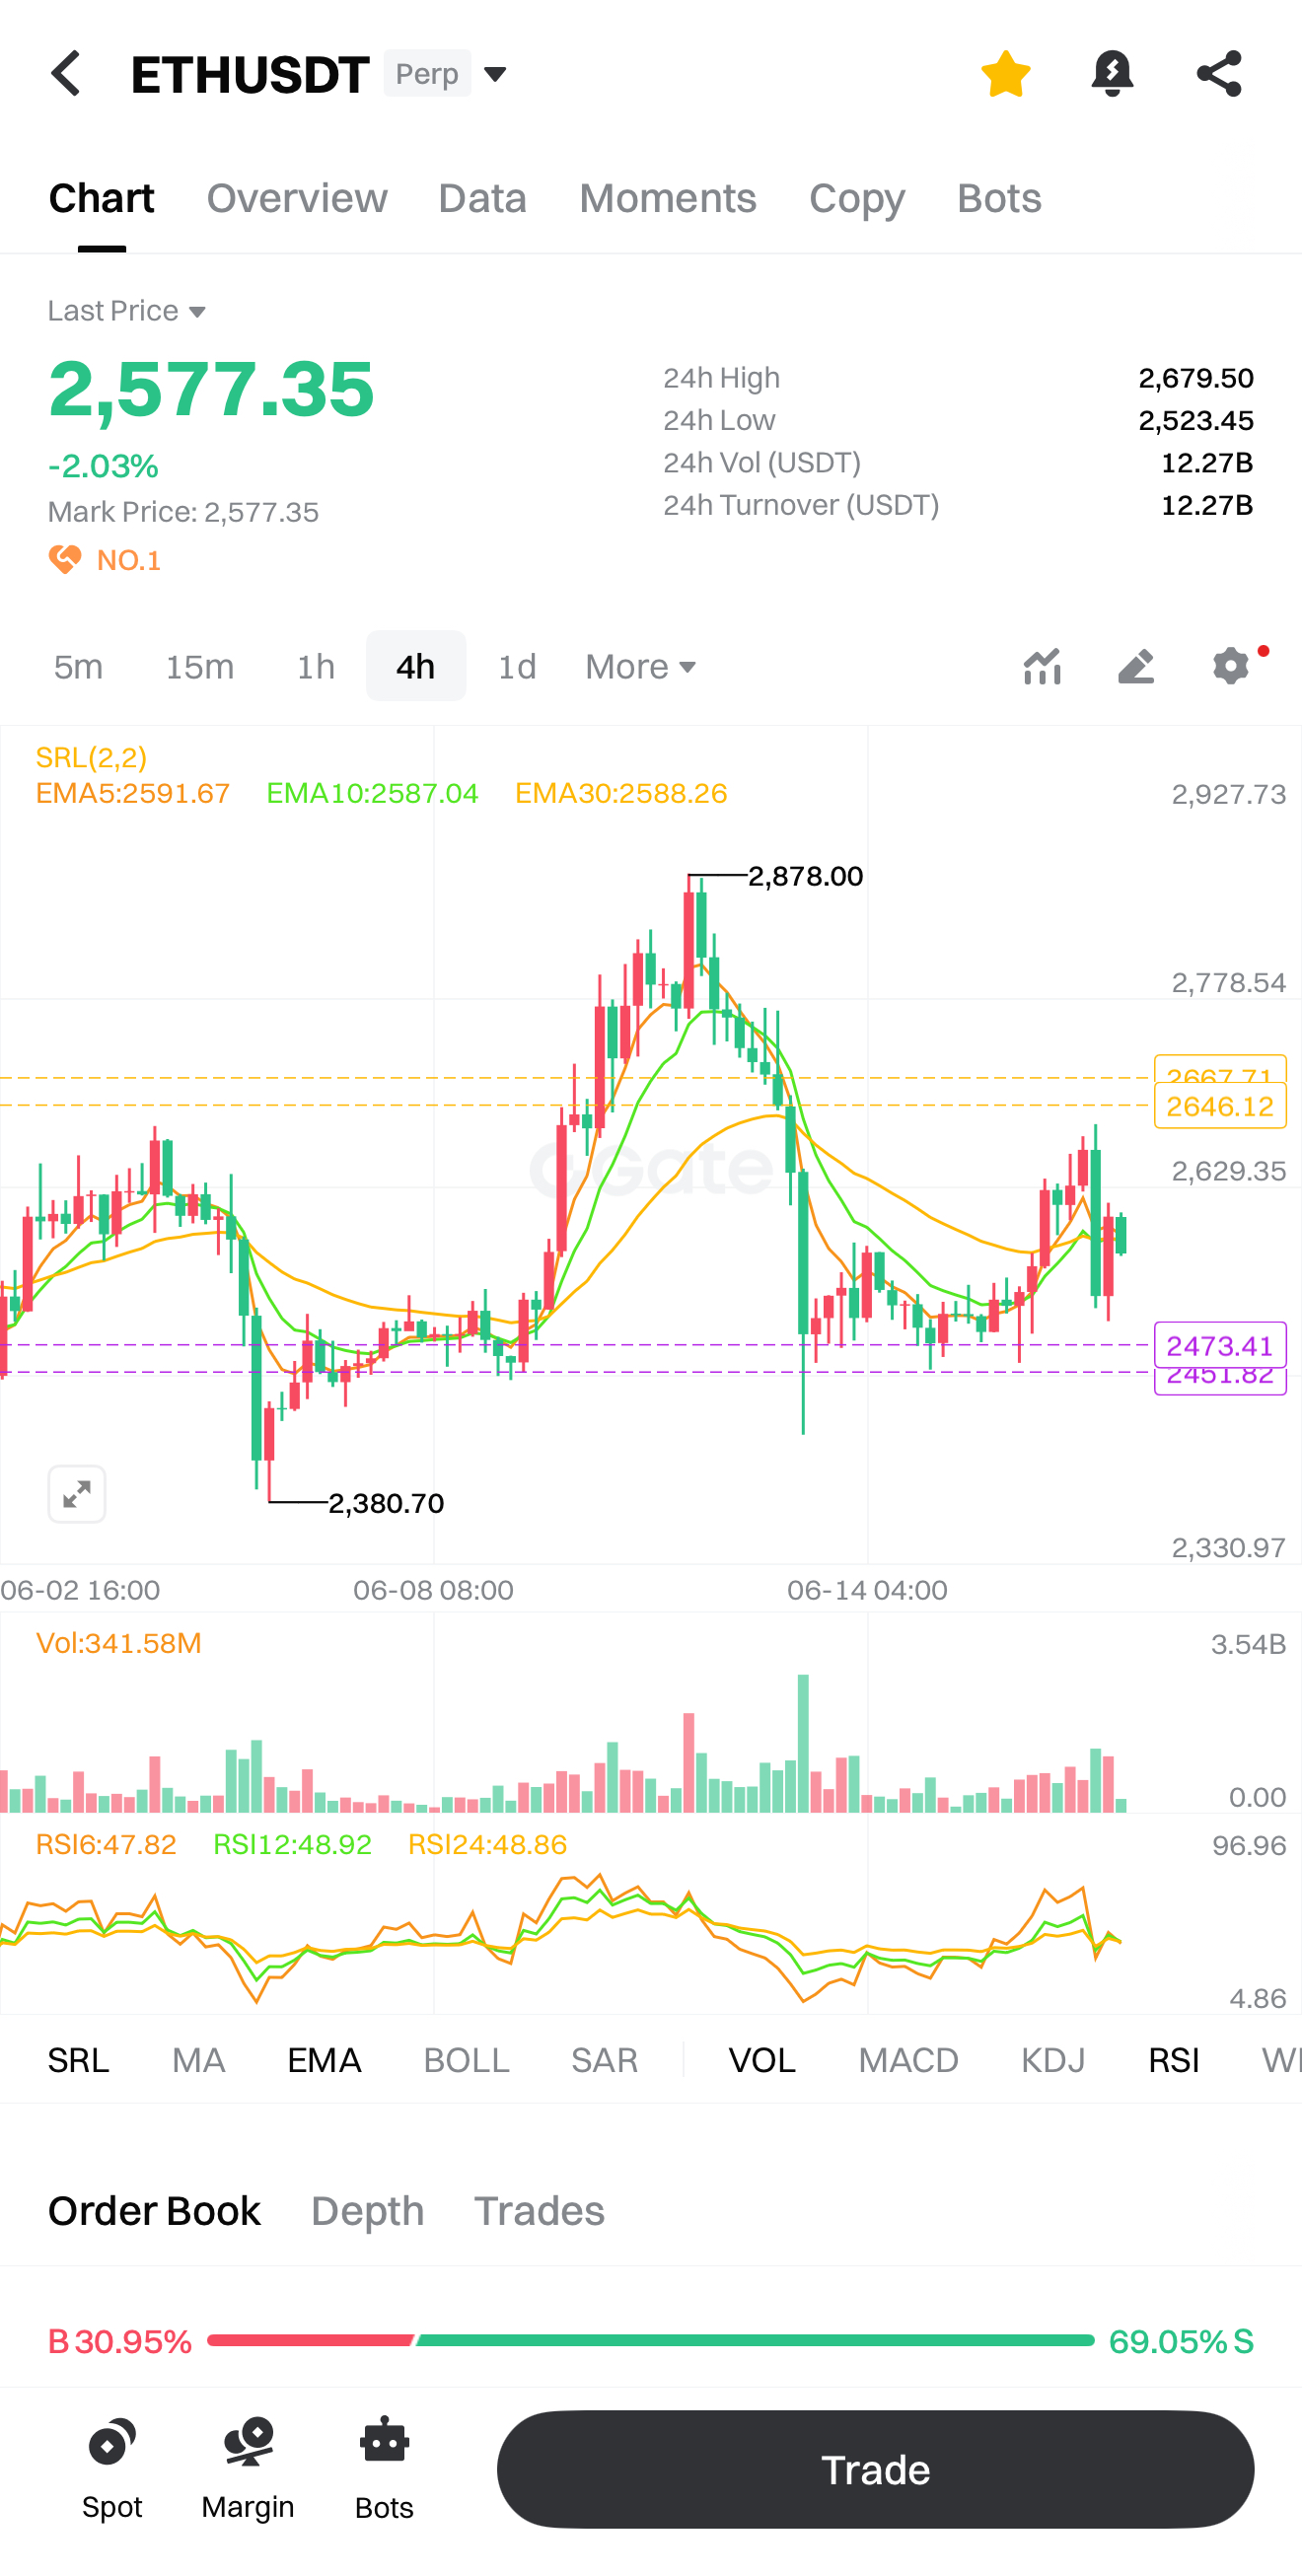
1.Go to the Trade page and tap the candle icon at the top right to access the candlestick chart.
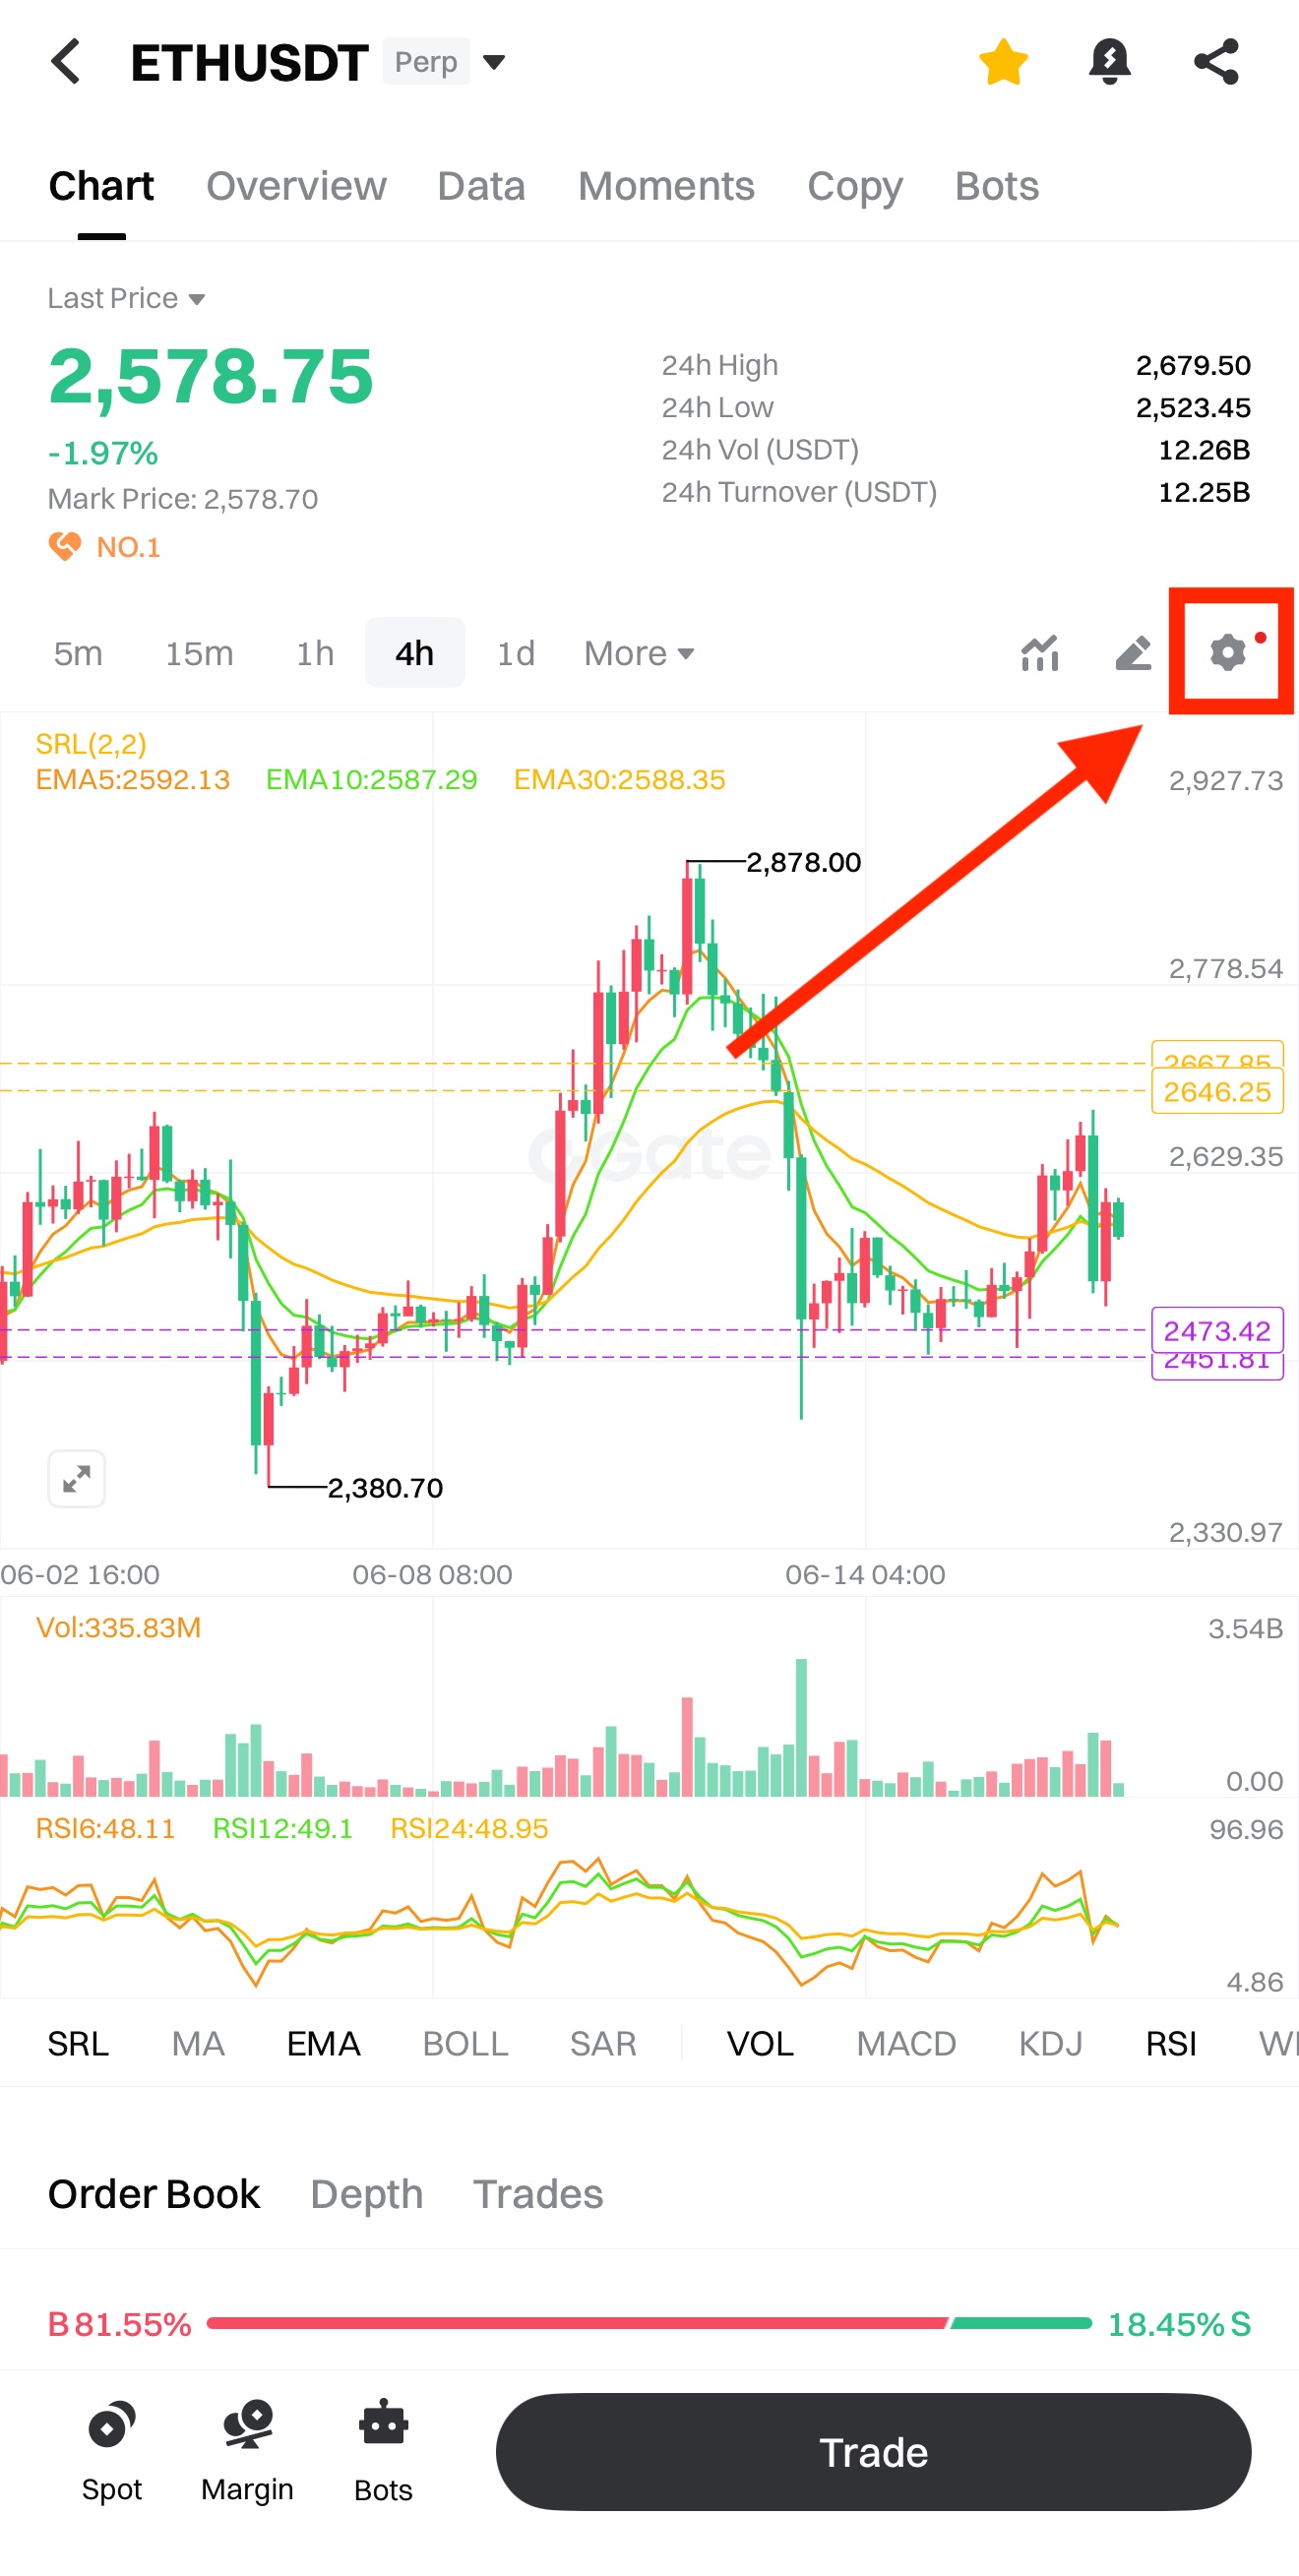
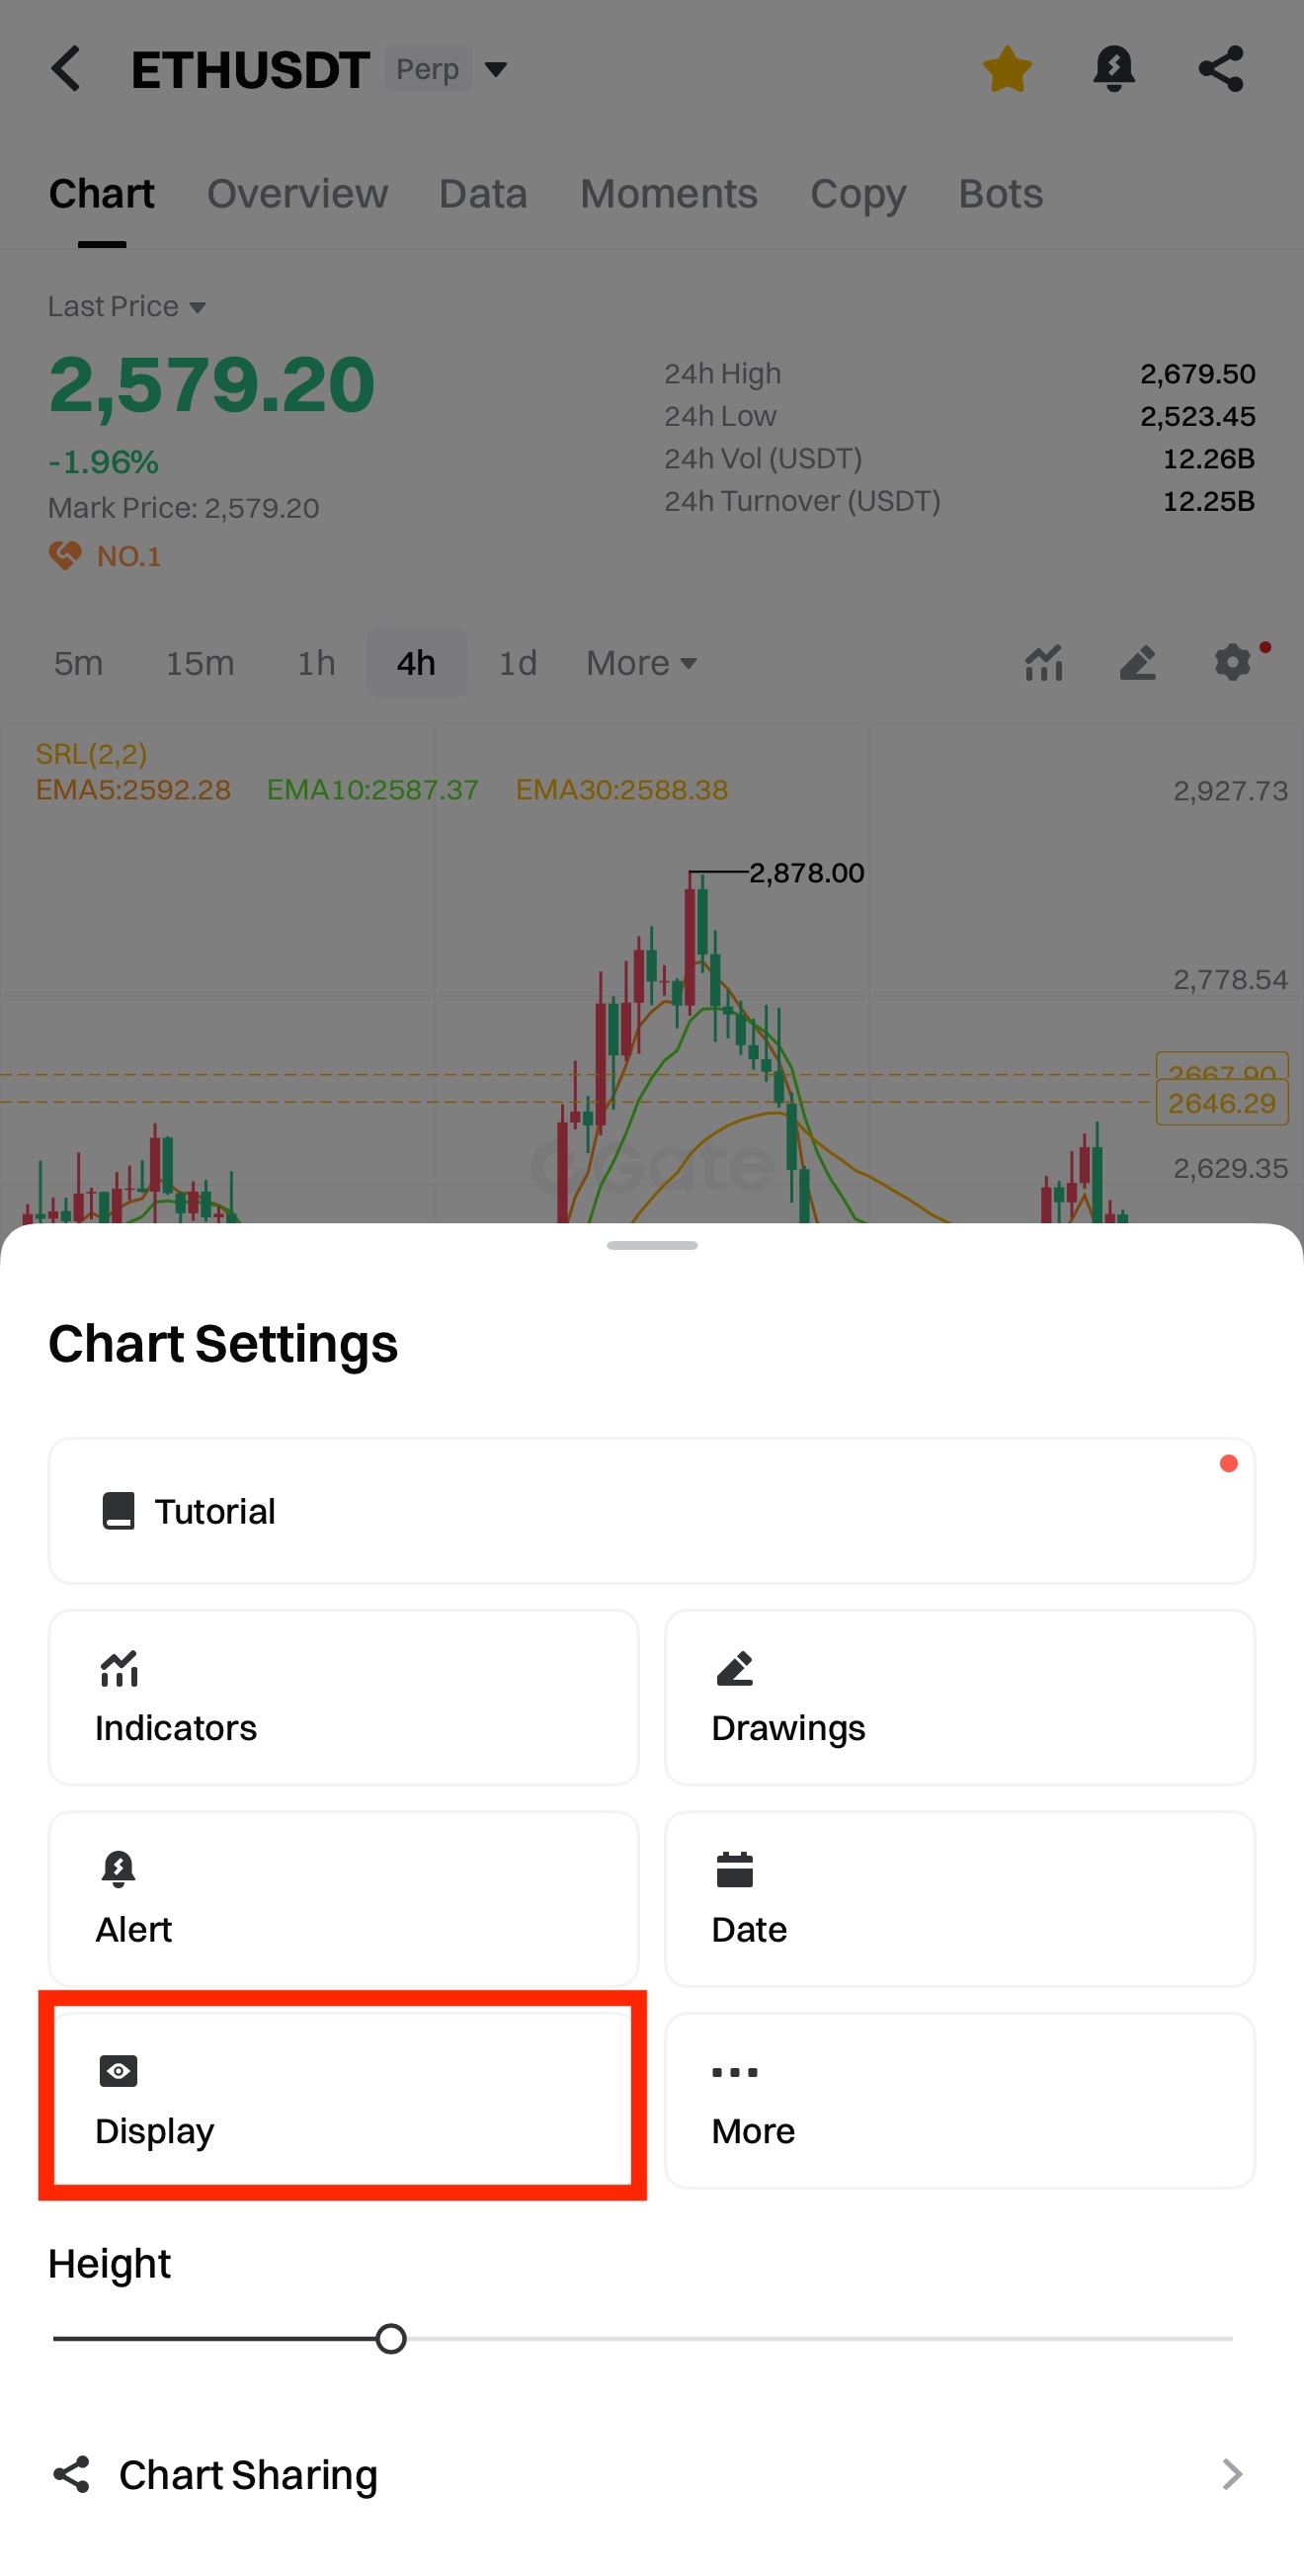
2.On the chart page, tap the Chart "Settings" button at the top right and select "Display".
3.In Display, toggle on "Order History".
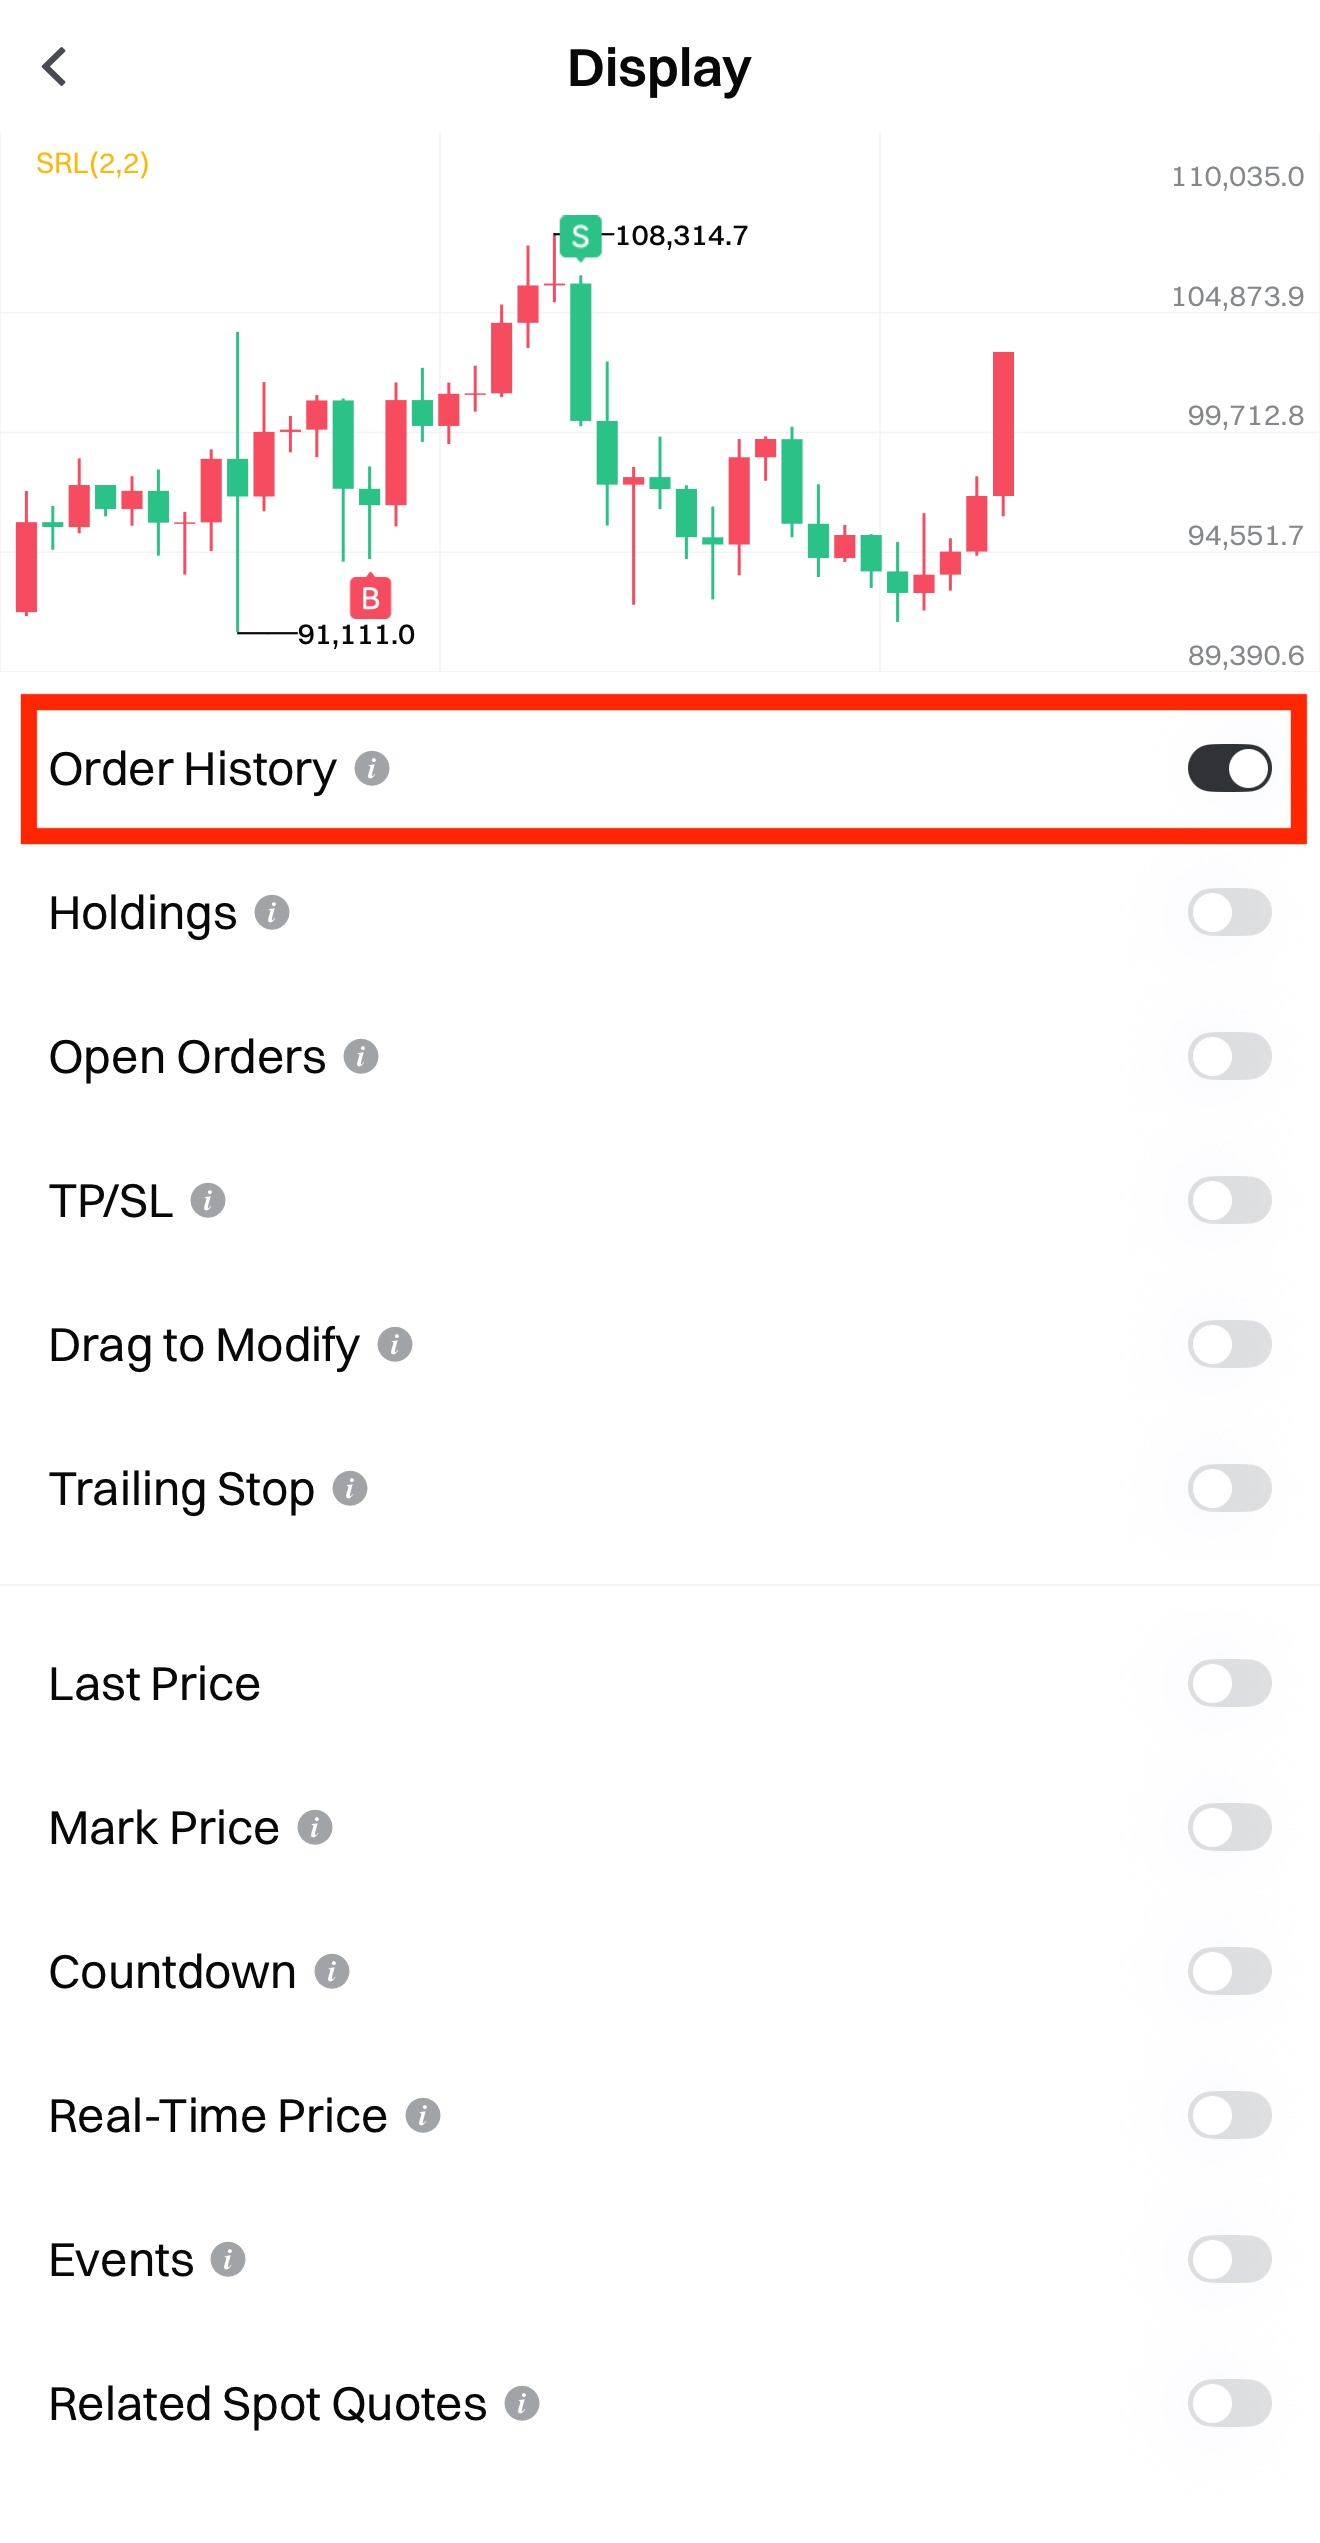
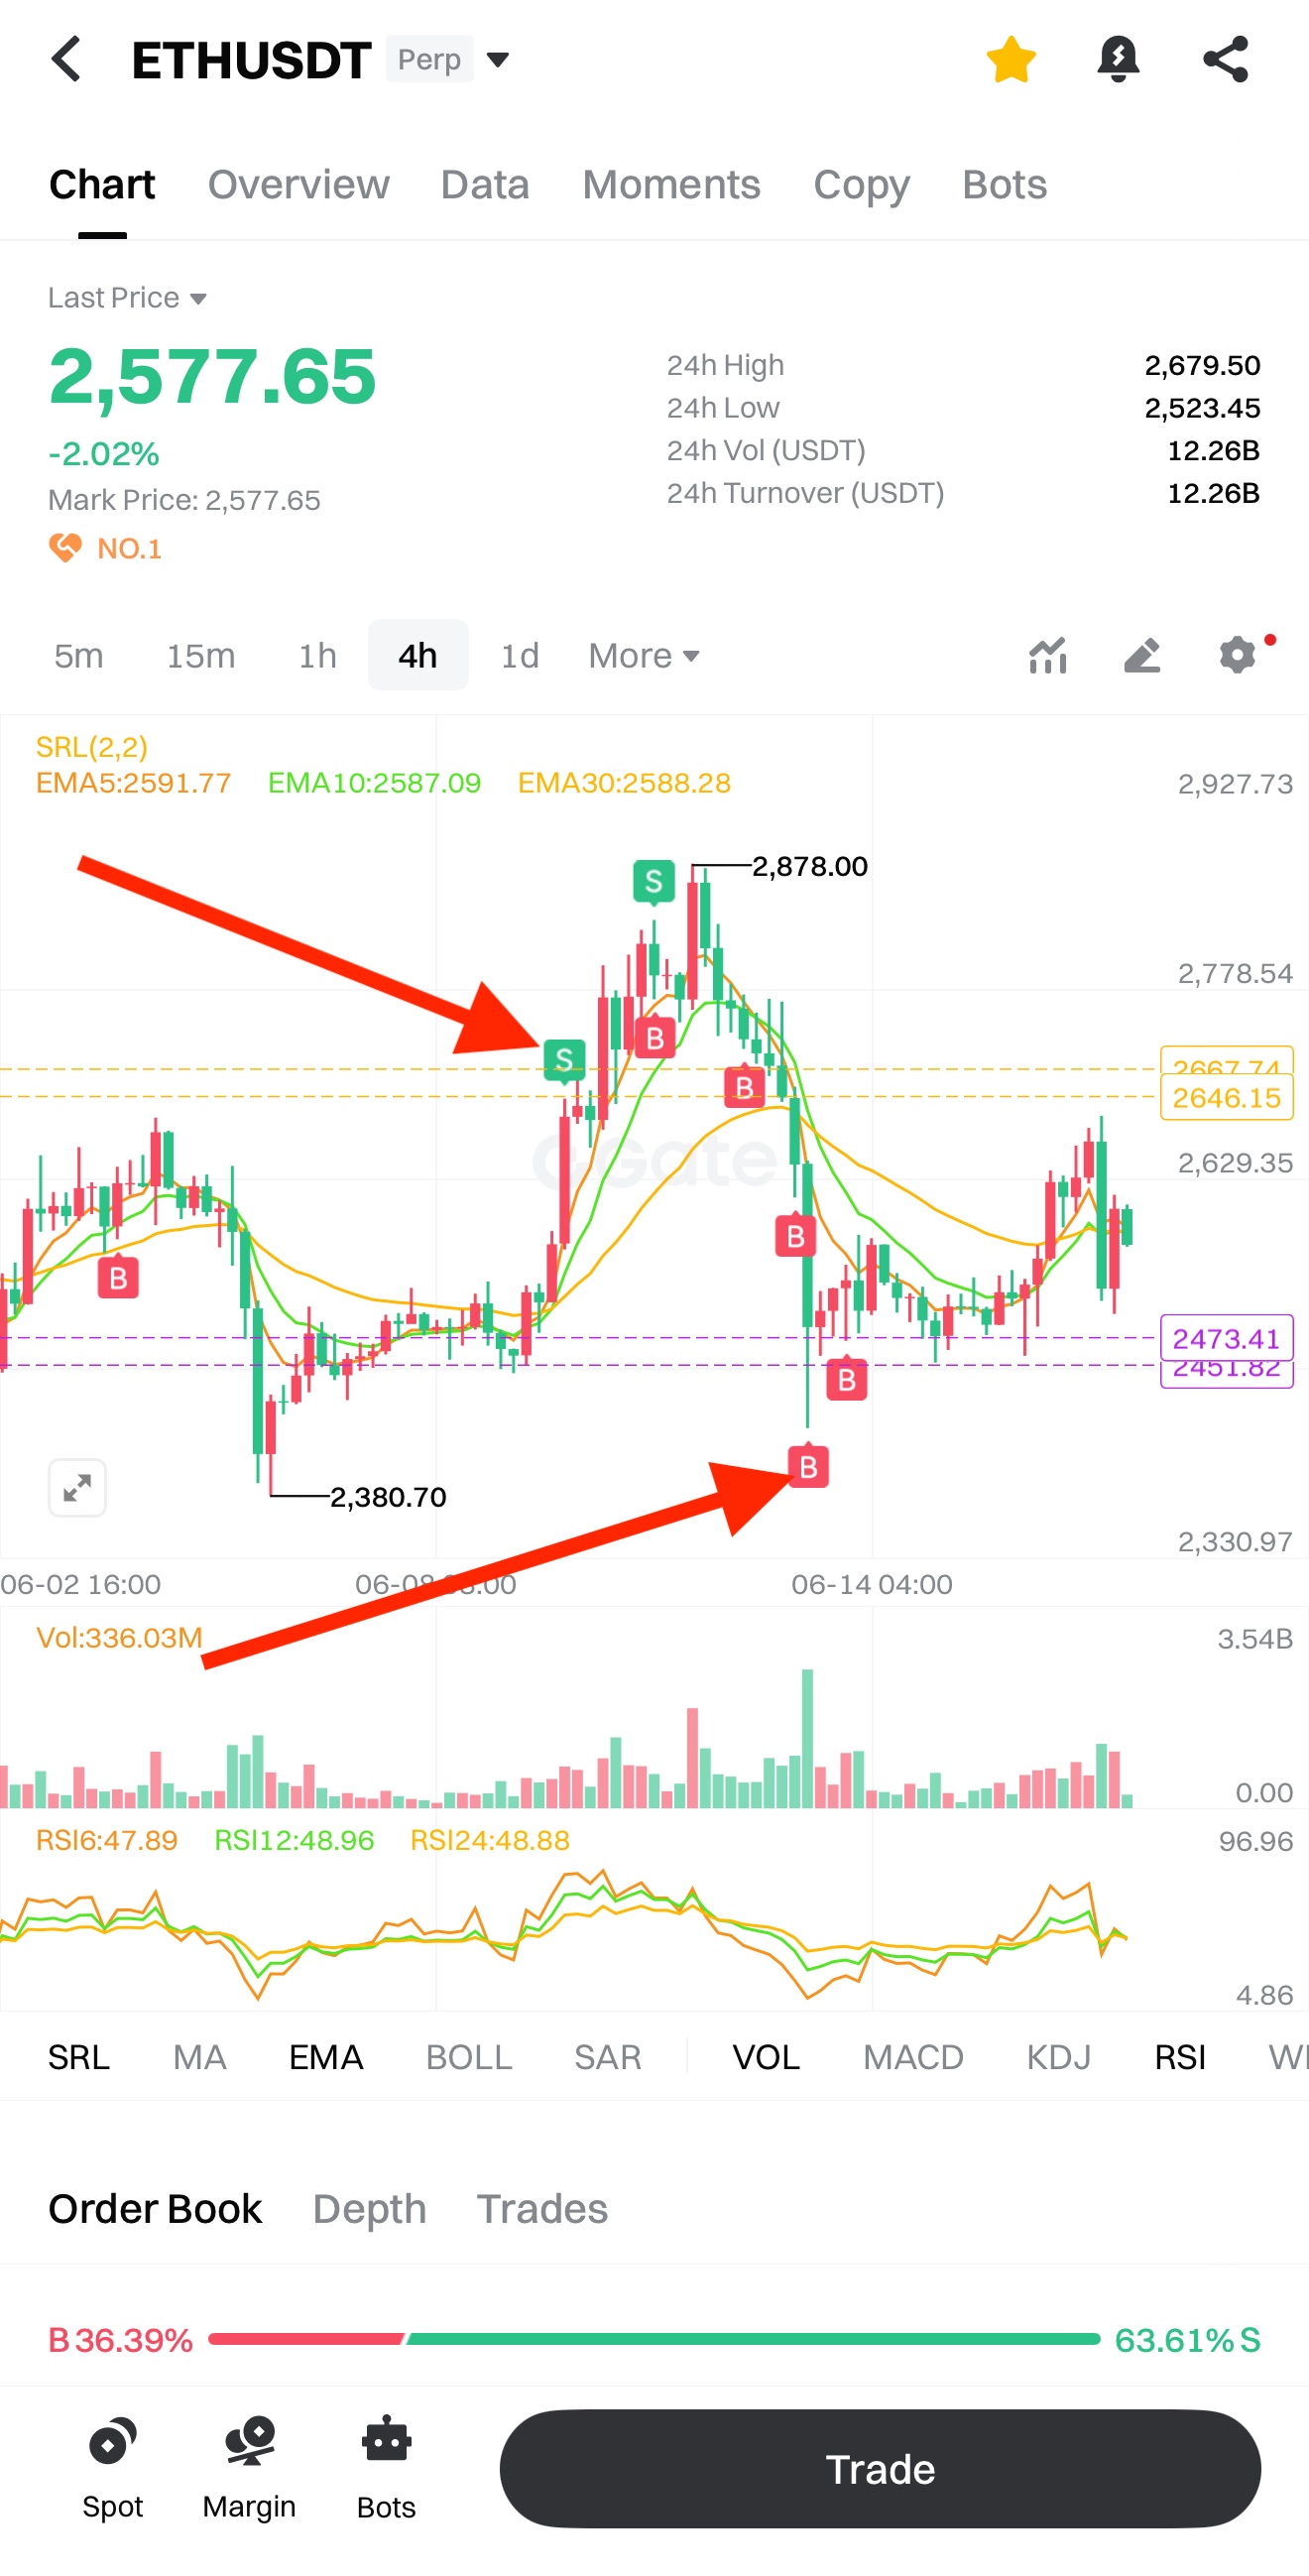
Once enabled, the chart will display filled orders from the past 30 days:
- Buy (B) markers appear below the candlestick chart;
- Sell (S) markers appear above the candlestick chart.
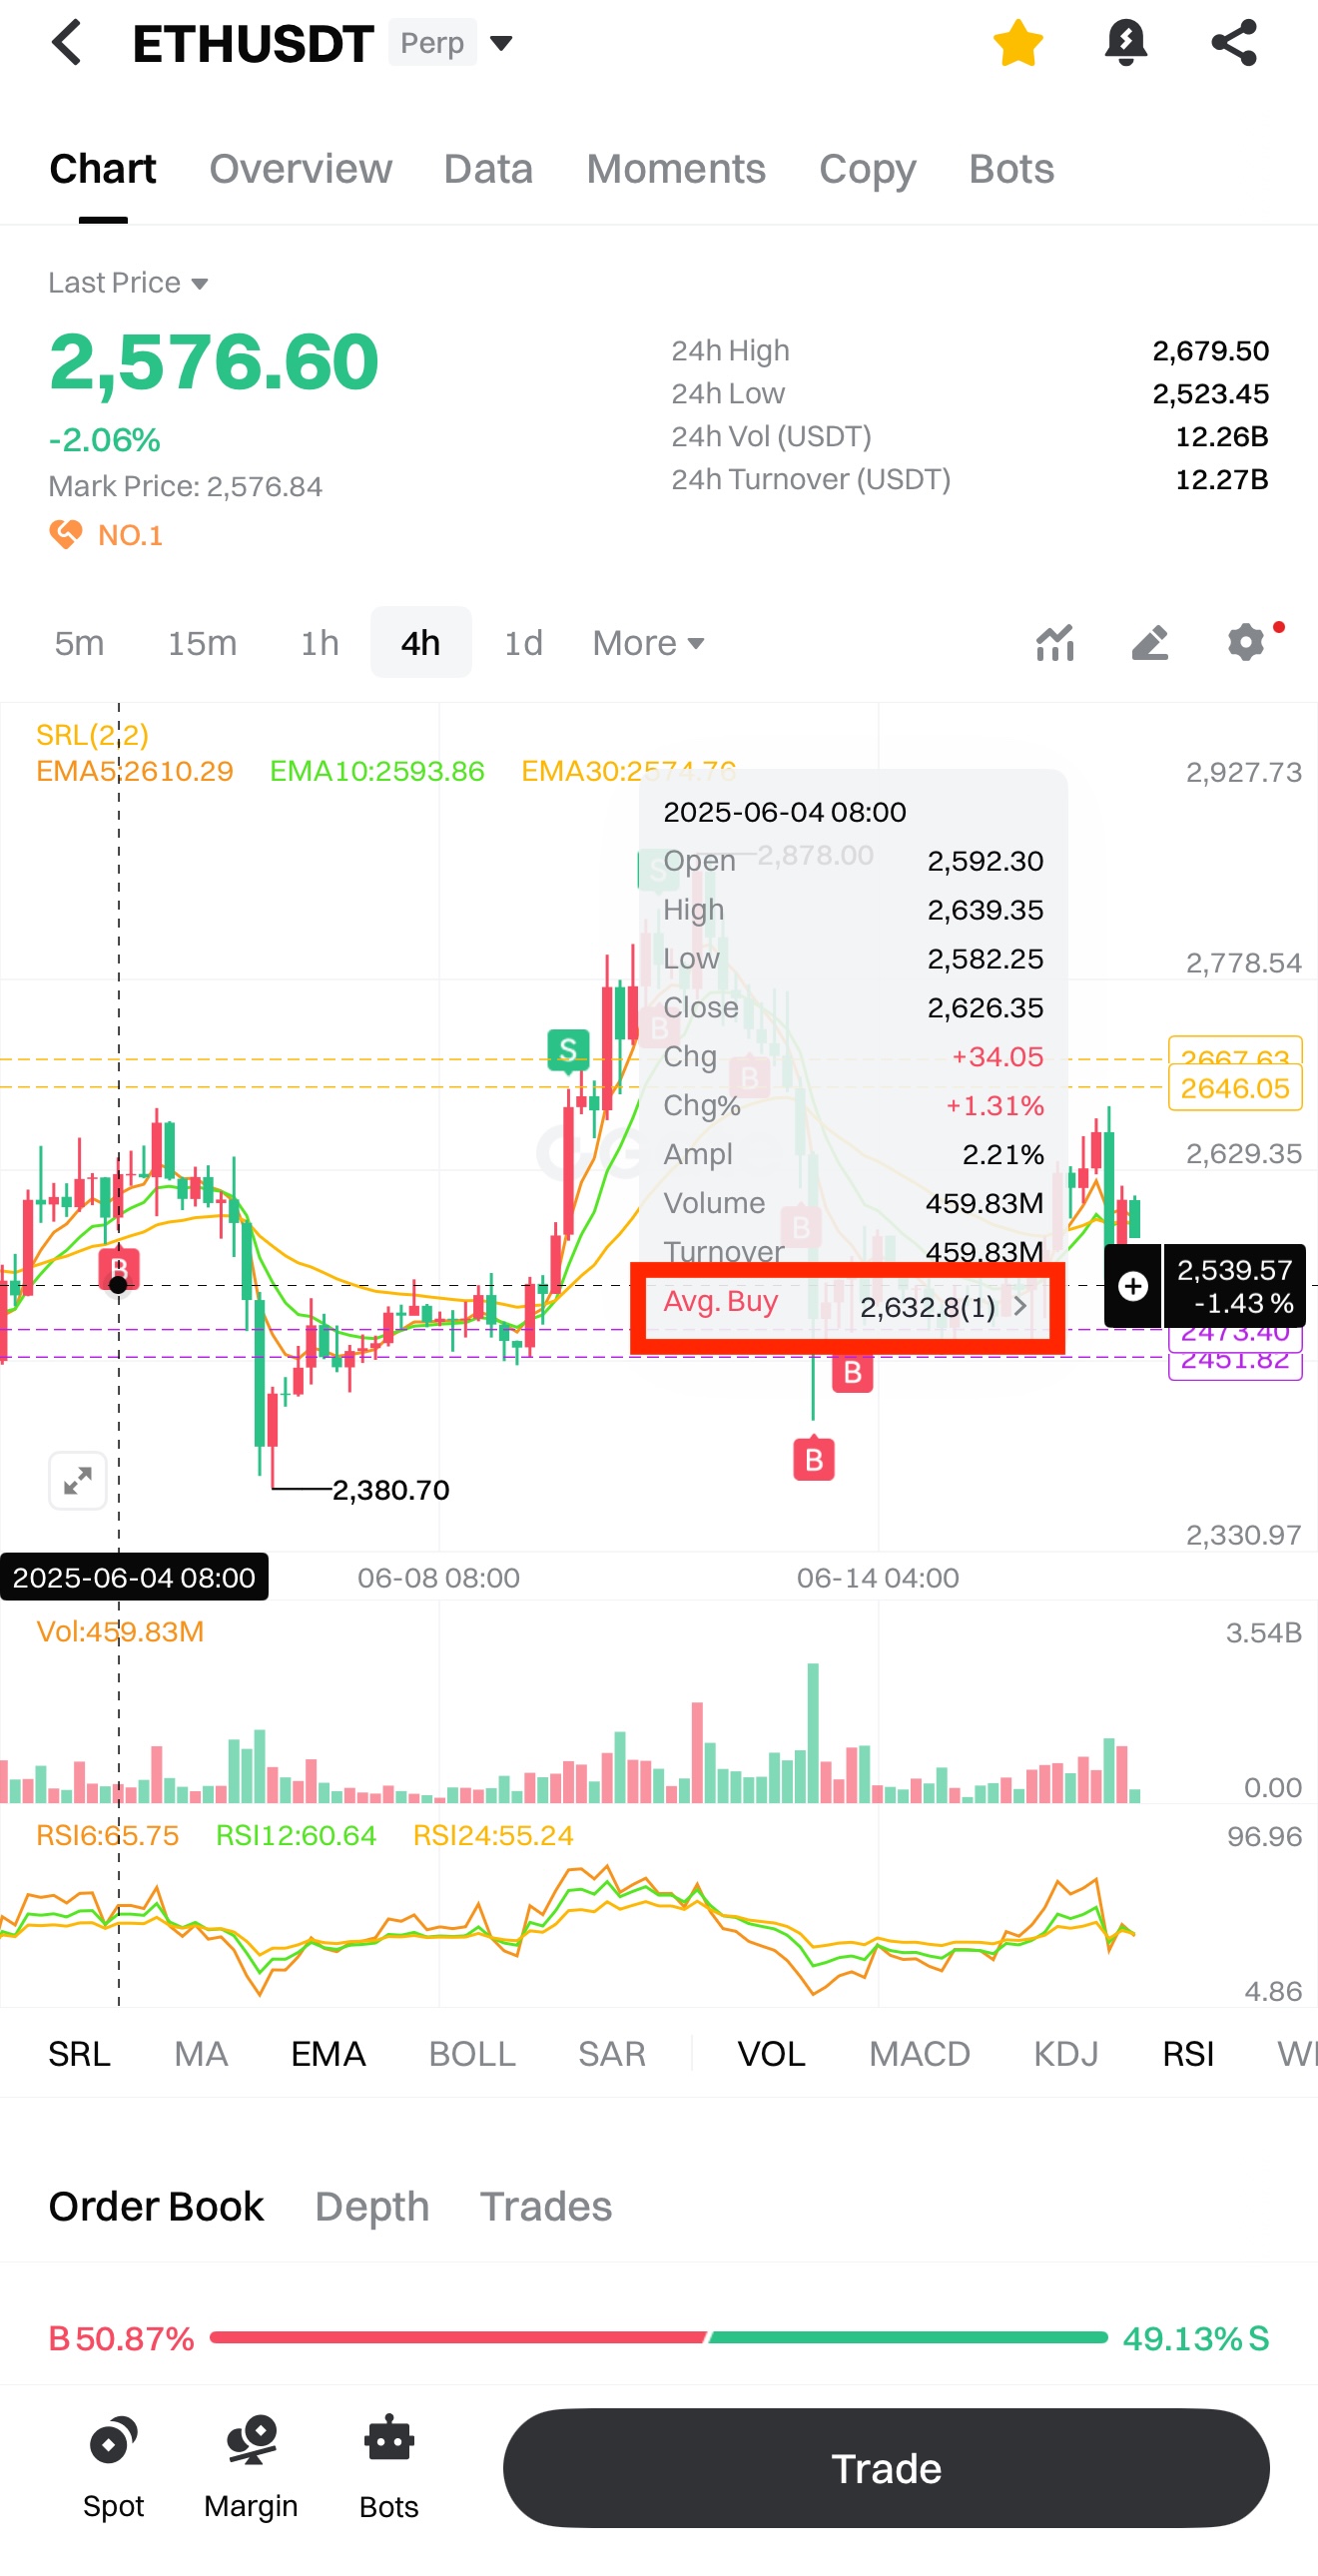
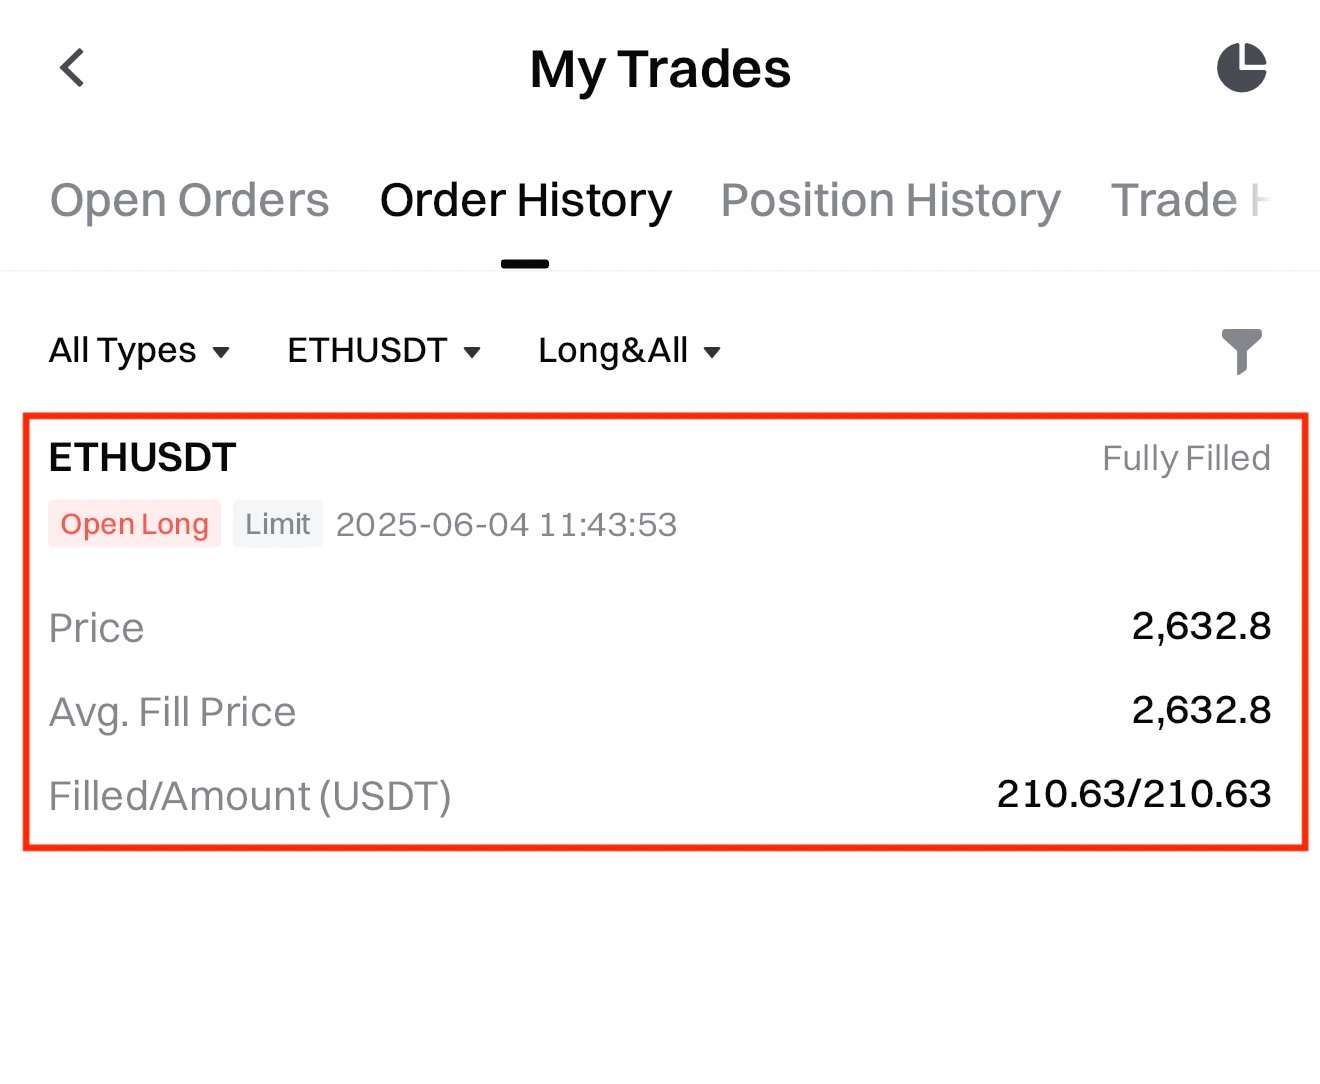
4.Tap any (B) or (S) marker on the chart to view details such as the average fill price , date, open, high, low, and close prices at that time. Tap the small arrow next to the average fill price to go directly to the order’s record in Order History.
2. How to Disable "Order History" on the Candlestick Chart
1.To hide "Order History", follow the same steps to open Display and toggle off Order History.
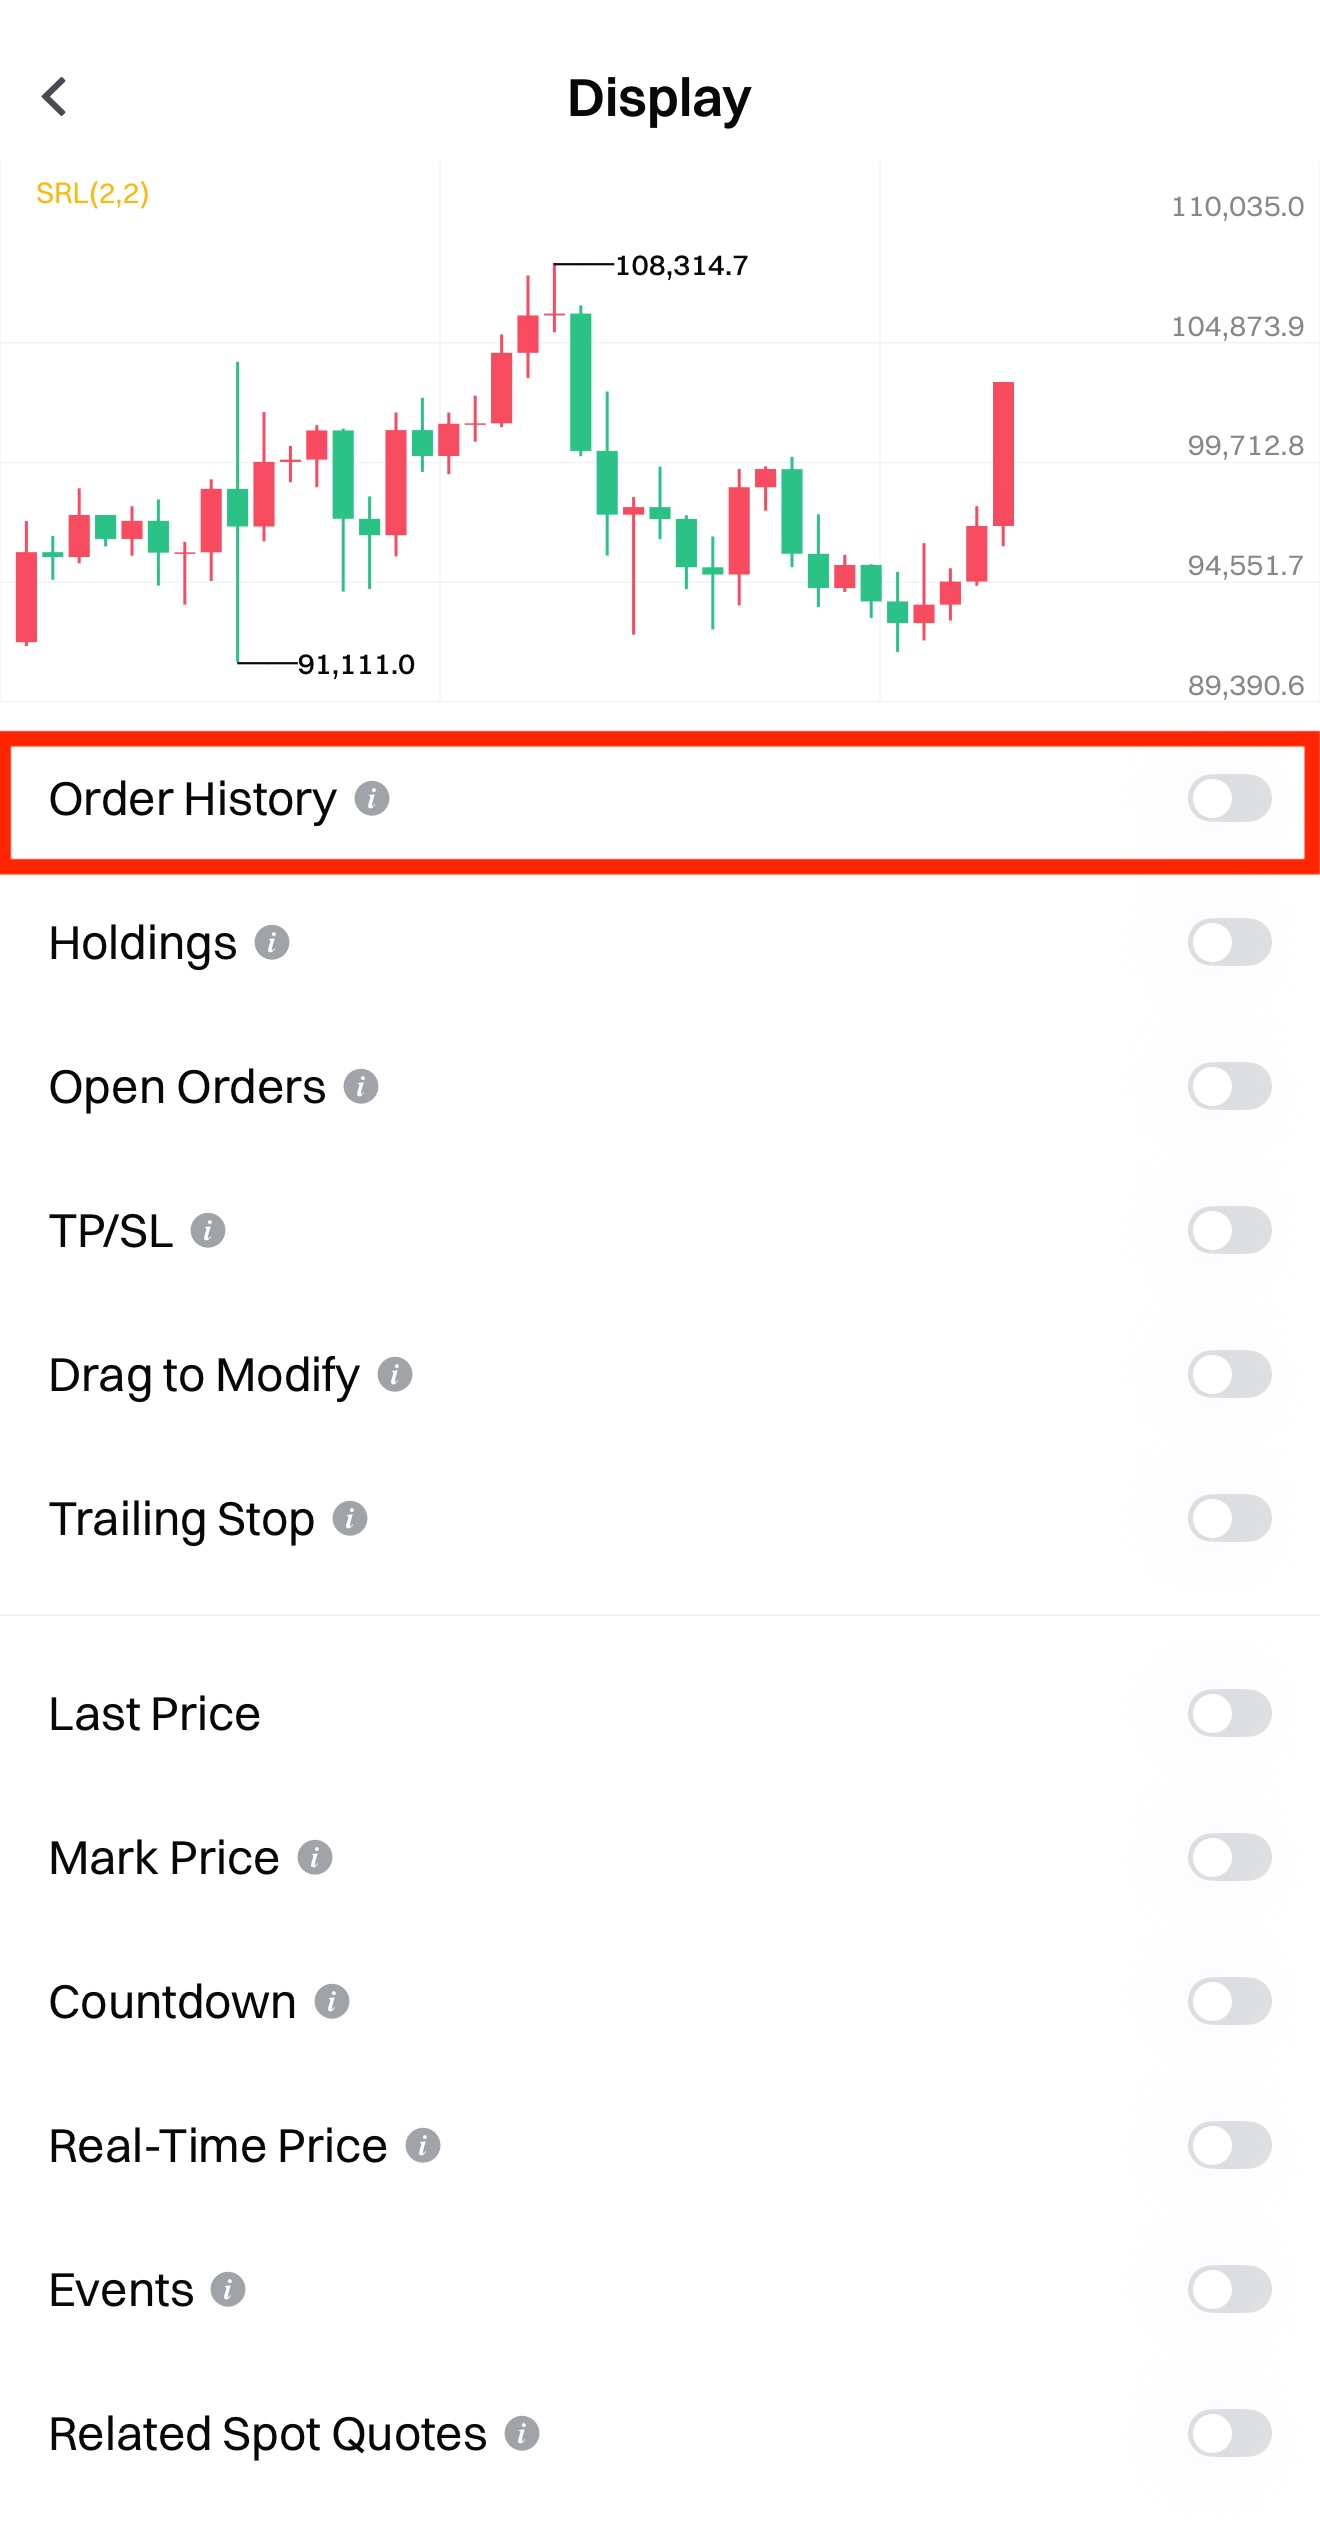
2.Once disabled, the chart will no longer show filled order markers.
If you encounter any issues, feel free to contact our Customer Support team.
Disclaimer
The content provided herein is for reference and educational purposes only and does not constitute any financial, investment, trading, or legal advice, nor does it constitute an offer or solicitation to buy or sell any digital assets. Gate makes no express or implied representations or warranties regarding the accuracy, completeness, or timeliness of the information contained herein. Product features, interfaces, rules, and fee structures may be updated or adjusted at any time. Please refer to the latest announcements and the actual information displayed on the Gate platform for the most accurate details.
Digital asset investments involve significant risk, and prices may fluctuate substantially. You may lose the entire amount of your investment. Please make decisions cautiously based on your own financial situation and risk tolerance after fully understanding the associated risks. If necessary, you are advised to consult an independent professional financial or legal advisor.
For more information about potential risks, please refer to Gate's Risk Disclosure and User Agreement.
